China’s CO2 emissions fell by 3% in March 2024, ending a 14-month surge that began when the economy reopened after the nation’s “zero-Covid”

www.carbonbrief.org
China’s carbon dioxide (CO2) emissions fell by 3% in March 2024, ending a 14-month surge that began when the economy reopened after the nation’s “zero-Covid” controls were lifted in December 2022.
The new analysis for Carbon Brief, based on official figures and commercial data, reinforces the view that China’s emissions could have peaked in 2023.
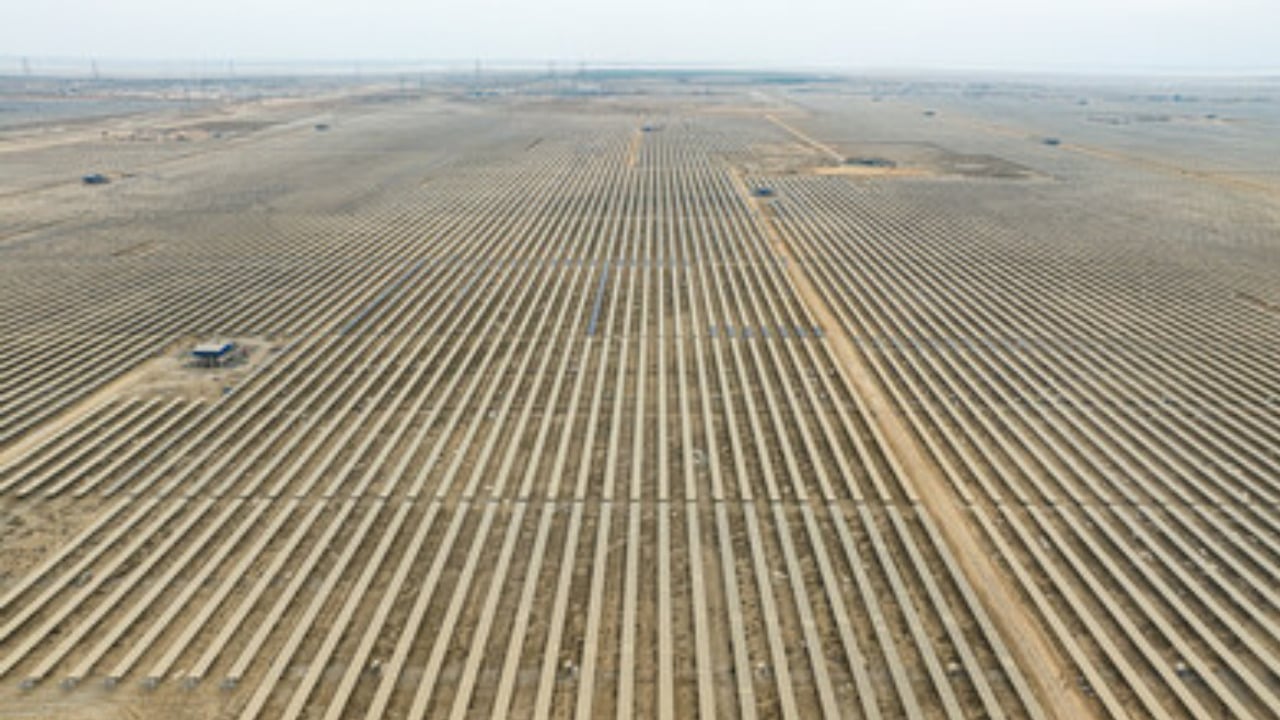
The drivers of the CO2 drop in March 2024 were expanding solar and wind generation, which covered 90% of the growth in electricity demand, as well as declining construction activity.
Oil demand growth also ground to a halt, indicating that the post-Covid rebound may have run its course.
A 2023 peak in China’s CO2 emissions is possible if the buildout of clean energy sources is kept at the record levels seen last year.
However, there are divergent views across the industry and government on the outlook for clean energy growth. How this gap gets resolved is the key determinant of when China’s emissions will peak – if they have not done so already.
Other key findings from the analysis include:
Wind and solar growth pushed fossil fuels’ share of electricity generation in China down to 63.6% in March 2024, from 67.4% a year earlier, despite strong growth in demand.
The ongoing contraction of real-estate construction activity in China saw steel production fall by 8% and cement output by 22% in March 2024.
Electric vehicles (EVs) now make up around one-in-10 vehicles on China’s roads, knocking around 3.5 percentage points off the growth in petrol demand.
Some 45% of last year’s record solar additions were smaller-scale “distributed” systems, creating an illusory “missing data problem”.
Why did emissions fall in March?
Looking at the first quarter of 2024 as a whole, China’s CO2 emissions increased significantly, based on preliminary data on energy consumption from the National Bureau of Statistics.
January and February of this year still saw large increases from the low base of 2023, when the economy was still subdued by the recent ending of zero-Covid restrictions.
As a result, CO2 emissions during the quarter increased by 3.8% year-on-year, with coal consumption growing 3%, oil 4% and gas 11% compared with the same period in 2023.
The turnaround happened in March, when CO2 emissions fell by 3%, due to a 1% fall in coal use, flat oil demand and a 22% drop in cement production. The reduction in CO2 emissions came despite a 14% rise in gas consumption, as the fuel is a minor part of China’s mix.
China’s CO2 emissions had started increasing in February 2023, after Covid-19 controls were lifted in December 2022.
The year-on-year comparison to January-February 2023 is, therefore, still affected by the low base caused by the last year of zero-Covid, making March the first month to give a clear indication of the emissions trends after the rebound.
The main driver of China’s emissions growth in recent years has been the power sector (see below).
Conversely, the main reason the emissions trend turned into a reduction in March was that power-sector emissions growth slowed down sharply. Emissions from the sector only increased by 1% year-on-year, due to strong growth in solar and wind power generation.
While power-sector emissions stabilised, the largest source of reductions in emissions in March was the continued decline in demand for steel and cement from the construction sector, as illustrated in the figure below.
Steel production fell by 8% and, as a result, there was also a fall in production of the main fuel used by steel mills – coking coal. Cement production fell dramatically, by 22% year-on-year.
These trends seem set to continue, as real-estate investment continued to contract – for the third year – as a result of a government clampdown on excess leverage and financial risk in the sector, and sizable supply resulting from booming construction in the past.
The contraction in construction volumes has not resulted in as large a drop in China’s demand for steel and other energy-intensive metals as might be expected.
The reason is rapid growth and investment in manufacturing, which uses metals for the construction of facilities and the production of industrial machinery.
It is unlikely that this manufacturing growth can continue, as global markets for different goods and commodities become saturated. The government’s economic policy now emphasises “new productive forces”, in the latest attempt to shift economic growth away from traditional heavy industry. The term refers to high-end manufacturing and R&D, which are, for the most part, less energy intensive than China’s traditional industrial sectors.
Looking at other sectors in March 2024, oil demand for transport was unchanged on a year earlier – following months of strong increases – suggesting that the post-Covid rebound could be petering out.
The production of jet fuel (+35%) and petrol (+7%) still increased, indicating growth in demand from passenger transport, but diesel production stagnated (+1%) and total crude oil refining volumes also only increased 1%.
The rise in the share of electric vehicles (EVs) is making a meaningful dent in oil demand, with the share of electric vehicles out of all vehicles on the road increasing to 10.5%, from 7.0% a year ago, as estimated on the basis of cumulative sales over the past 10 years. This indicates that EV adoption lowered petrol demand growth by 3.5 percentage points.
Gas demand rebounded sharply, increasing 14% year-on-year, after a drop caused by high gas prices. Growth in gas consumption came predominantly from industry and households.
Power-sector gas consumption increased 8%, as the utilisation of gas-fired power plants recovered, but this only contributed a small fraction of the overall growth.
The share of gas in China’s energy mix fell from 2021 to 2023, after more than two decades of continuous increases, and has only now started to resume growth.
One recent driver of emissions increases continued: coal consumption in the chemical industry increased 14%, extending the double-digit growth seen in 2022 and 2023.
While there is not yet enough data to estimate CO2 emissions in April, industrial data for the month indicates that the trends seen in March continued.
Thermal power output – mostly from coal – grew at a slow rate of 1.3%, with most demand growth being covered by solar. Steel, cement and coke output fell by 8%, 9% and 7%, respectively, reflecting continued decline in construction volumes. Oil refining volumes fell 3%.
Domestic coal mining output fell 3% while imports increased 11%, meaning total supply fell 5%.
Gas demand saw further strong growth, with imports increasing 15% and domestic production 3%. Among energy-intensive industries, the chemical and non-ferrous metal industries continued rapid output growth.
Solar and wind covering demand growth
The stabilising emissions in the power sector are notable because electricity demand growth continued at a high rate of 7.4% – and hydropower utilisation stayed below the long-term average, affected by a prolonged drought.
Electricity demand growth has been exceptionally fast during the past few years, driven predominantly by industrial power use. In March, industrial demand growth slowed down, but a rebound in the service sector sustained overall growth.
Half of demand growth came from industry, with non-ferrous metals, chemicals, machinery and electronics the largest growth areas. One third came from services, with wholesale and retail trading the largest growth driver, and one sixth from households.
Household power demand has also seen a surge in the past couple of years, driven by a wave of air conditioning unit purchases triggered by the historic heatwave in 2022, especially in lower-income households that lacked air conditioning before.
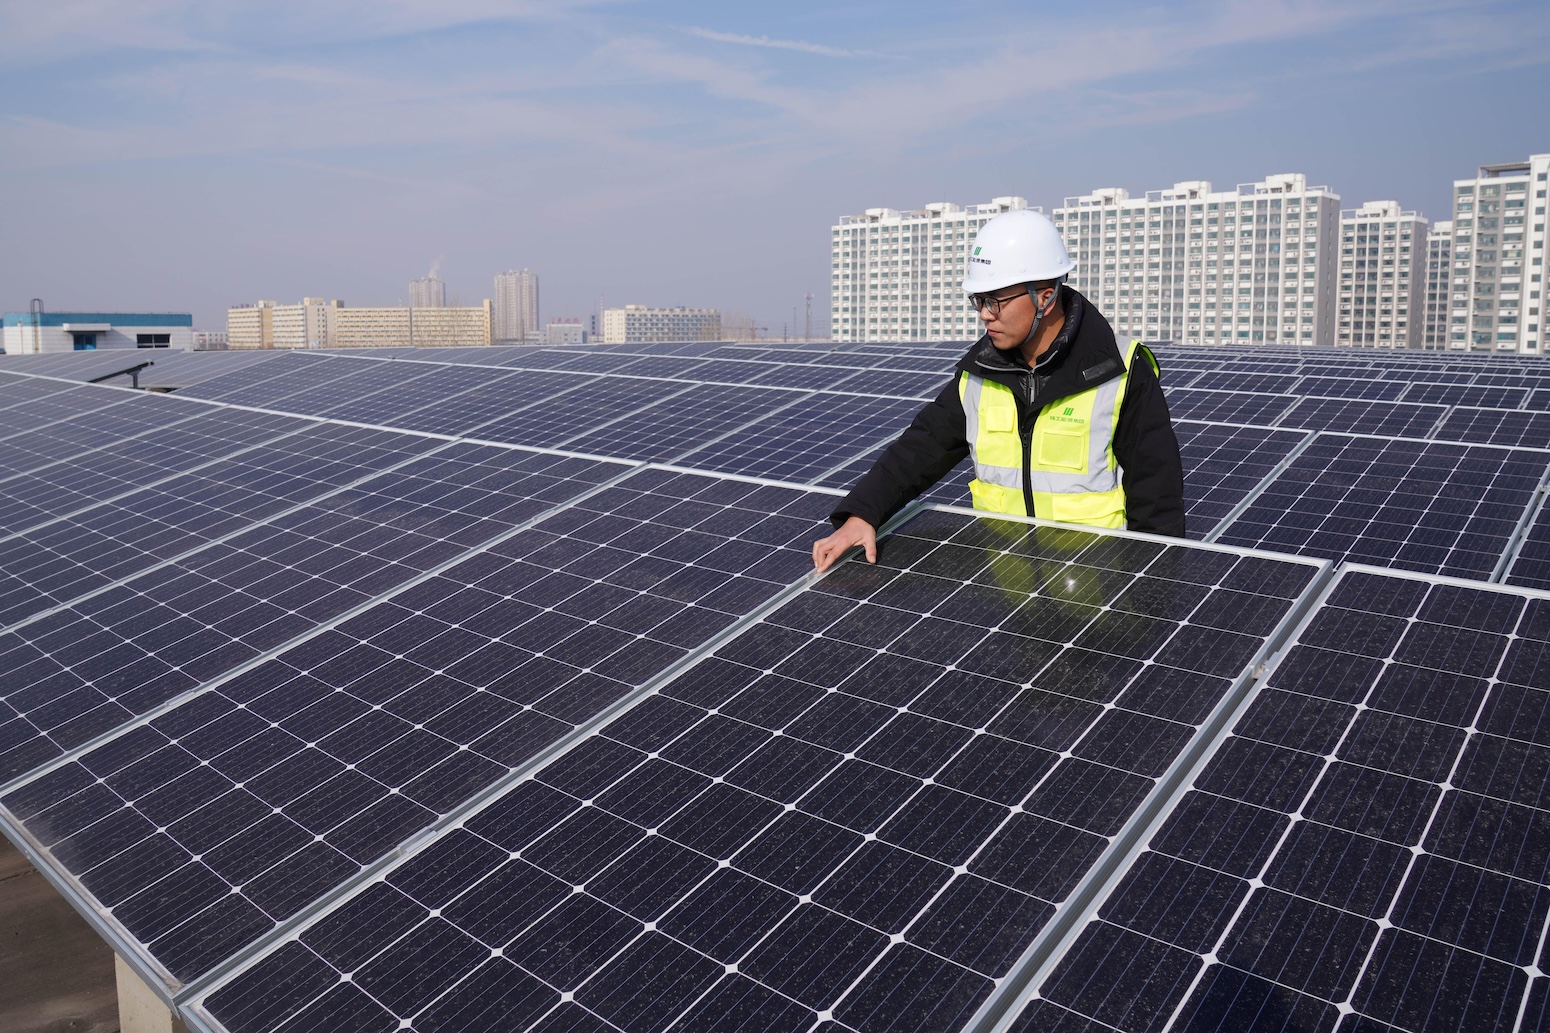
Despite rapid growth in electricity demand, the rate of growth for large-scale power generation slowed to 3%, due to rising distributed solar power generation.
(Distributed solar refers to smaller-scale installations, often on the rooftops of homes and businesses, in contrast to the large, centralised solar farms.)
Overall, the record addition of solar and wind capacity in 2023 enabled these sources to deliver 22% of power generation and almost 90% of year-on-year growth in March, as shown in the figure below. The share of non-fossil power generation rose to 36.2%, from 32.6% last year.
The growing contribution of distributed solar power to generation has been somewhat hidden by the way that China’s monthly electricity data is reported. The National Bureau of Statistics only reports monthly power generation from very large-scale solar and windfarms. It has also made systematic upward revisions of previous year’s data, suggesting it had not captured output from new firms entering the market in real time.
As 45% of last year’s record solar additions were distributed generation, the exclusion of small solar installations is affecting these numbers a lot more than it used to.
This has caused a lot of confusion in China and overseas, especially as the reported electricity consumption became much larger than generation – an apparent impossibility. Bloomberg even called this a “missing data problem”.
The widening gap between electricity consumption and large-scale power generation makes it clear, however, that distributed solar is increasingly contributing to meeting electricity demand.
Unlike the monthly figures, there is no “missing” data in China’s annual reporting, as the yearly statistics include all power plants regardless of size. In 2023, for example, the annual statistics reported twice as much solar and 10% more wind power generation than the monthly statistics.
Indeed, calculating generation from reported installed capacity and utilisation hours of the capacity on a monthly basis reproduces the annual numbers closely. This makes it clear that the expansion of small-scale solar is contributing substantially to meeting electricity demand, even if the statistics bureau’s monthly data does not cover the power generation.
Clean energy boom continues
The fall in emissions in March was enabled by last year’s massive solar and wind power additions, with almost 300 gigawatts (GW) of new capacity connected to the grid. This boom accelerated in the first three months of 2024, with a 40% increase compared with the year before.
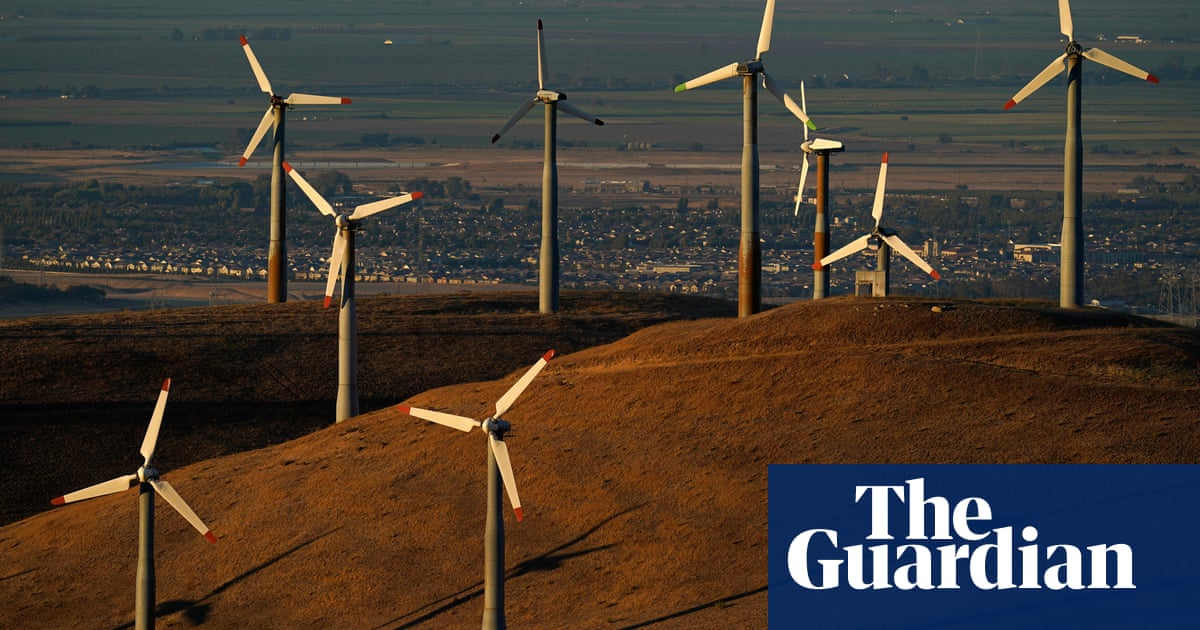
Solar power installations stood at 46GW, up 36% on year, and wind power installations at 16GW, increasing 50% year-on-year.
The first months of the year tend to be slower in terms of installations – and there are also gaps in reporting that mean that quite a bit of new capacity is only reported at the end of the year.
The strong year-on-year growth indicates that concerns about grid access for new projects have not affected the pace of capacity additions yet. Even if growth rates are tempered for the rest of the year, the numbers to date indicate that last year’s record pace could be maintained in 2024.
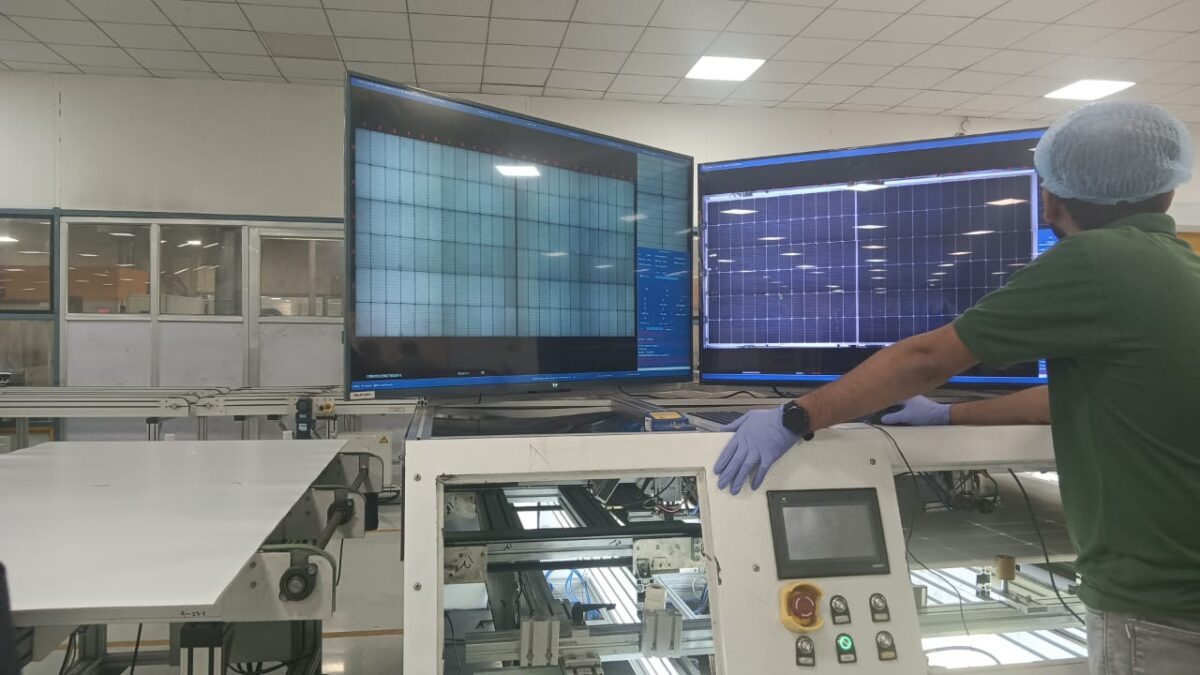
Solar panel production grew another 20% in January-March from last year’s already significant numbers, signalling strong demand from China and overseas.
EV production grew 29% while total vehicle production resumed its fall, so the share of EVs continued its rapid climb, reaching 31% in the first quarter compared with 26% the year before.
As the economics of solar and wind projects are strong, the main constraint on capacity additions will be grid access. Numerous provincial grid operators already began to limit additions of new wind and solar last year, as they were concerned that they would not be able to fully integrate the additional generation.
This highlights the shortcomings in China’s grid operation, because such challenges are arising when the share of wind and solar power in China’s power generation is still modest, at 15%, compared with 27% in the EU and 40% in Germany, Spain and Greece.
Action is being taken. The NDRC has begun to relax requirements for the grid access of solar and wind generators. This will increase the uncertainty for investors in wind and solar projects, but makes it easier for grid operators to integrate more capacity and will, therefore, support growth in capacity and generation.
The NDRC also issued a policy on developing electricity storage, pledging that, by 2027, the power system would be able to integrate new solar and wind capacity while keeping the share of their output that is wasted due to grid issues to a low level.
While solar and wind are beginning to cover most or all of power demand growth, investment in coal power is continuing. Additions of thermal power capacity slowed down slightly year-on-year in the first quarter, but provinces’ “key project lists” for 2024 include over 200GW of thermal power projects, which are mainly coal-fired.
Future ambition a major question mark
The fall in China’s emissions in March could mark the turnaround after blistering growth since 2020. As explained in analysis for Carbon Brief published last autumn, the current growth rate of clean energy has the potential to peak the country’s emissions.
Whether the clean energy growth will continue is, therefore, the key question for the future path of China’s emissions. However, views about the pace of future wind and solar developments diverge widely.
The China Photovoltaic Industry Association (CPIA) forecasts average annual capacity additions of 225GW from 2024 to 2030 in its “conservative” scenario, a slight increase from the 217GW installed in 2023. Its “optimistic” scenario would see this accelerate to 280GW per year. Under the CPIA’s projections, China’s total installed solar capacity reaches 2200-2600GW in 2030, up from 660GW today.
According to the wind power industry, China needs to install more than 50GW of new wind power capacity annually from 2021-2025 and more than 60GW annually from 2026 onwards, in order to reach the 2060 carbon neutrality target. This is a fairly modest trajectory, since capacity additions in 2023 were already 76GW.
On the other hand, the head of the National Energy Administration (NEA) Zhang Jianhua wrote in a recent article that clean-energy capacity additions should be kept above 100GW per year, less than half of the level achieved in 2023, implying that he views the recent acceleration as an anomaly and not something to be maintained.
Similarly, the NEA’s 2024 workplan targets 170GW of non-fossil power capacity added, as implied by the targets for total generating capacity and the share of non-fossil energy capacity. (Despite the 160GW target in the 2023 workplan, additions reached nearly 300GW.)
These alternative visions of wind and solar expansion are shown in the figure below. The dark blue line shows Zhang’s expectation that annual capacity additions would return to levels seen during 2020-2022, while the light blue and red lines show the renewable industry forecasts of growth broadly being maintained at 2023 levels – or steadily increasing.
The difference between the CPIA and NEA levels of ambition amounts to 1,400-1,800GW of solar and wind power capacity by 2030. If the resulting clean power generation were to replace coal in 2030, the difference in CO2 emissions would amount to 10-15% of China’s current emissions. By 2035, with a continuing trend in wind and solar growth, the CO2 saving would reach 20-25% of current emissions.
In his article, Zhang points to a number of challenges that could justify the lower level of clean-energy capacity additions that he is proposing, including the lack of a robust pricing mechanism for electricity storage, the need for better coordination of policies on the energy transition, as well as managing the land and marine area requirements for large new energy projects.
Still, dialling back the additions of solar and wind, as well as the associated battery storage, would be a cold shower to China’s economy, as these clean energy sectors have become a key source of economic growth.
Moreover, massive recent investments in manufacturing capacity in these sectors will only be utilised and pay off with continued growth in the demand for clean energy equipment.
The lower level of ambition of the government is also reflected in official targets for this year. The environmental ministry recently set a target to reduce carbon intensity – the level of emissions per unit of GDP – by 3.9% in 2024.
This target, if met, is an increase over the past three years when carbon intensity improved by only 1.5% per year on average. Yet, given that the target for GDP growth is “around 5%”, the carbon intensity target allows emissions to increase by more than 1%.
After rapid emission increases in 2021 to 2023, China is already severely off track for its 2025 and 2030 carbon intensity targets – and the annual targets for 2024 fail to close this gap.
Instead, it is exactly the required annual average that would have been needed every year to meet the 14th five-year plan target of 18%. As such, it avoids the existing shortfall from getting wider, but does nothing to make up for slow progress to date. The NDRC set a less ambitious target of reducing “fossil energy intensity” by 2.5% in 2024, which allows emissions to increase by more than 2%.
Zhang Jianhua also argued that clean energy should cover 70% of energy consumption growth in 2026-30, a target that is consistent with a slowdown in clean energy additions.
This would mean that 30% of energy consumption growth would still be covered by increasing the use of fossil fuels – and, therefore, CO2 emissions would also continue to increase.
Continued emissions growth would imply a major risk of missing China’s 2030 carbon intensity commitment – which is part of its international climate pledge under the Paris Agreement – as there is no space for energy-sector CO2 emissions to increase from 2023 to 2030 under the commitment, assuming average GDP growth of 5% or less.
China’s pledge, therefore, depends on clean energy growth continuing to significantly exceed the central government’s targets – or those targets being ratcheted up.


 www.pv-magazine.com