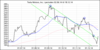
Would love to see a chart with 200 day MA and 50 day MA so we could gain perspective on this move up. Oh keepers of the charts, cloaked in ye ancient arts of TA, share thine magic with us, and help us slay the dragons of FUD.
Last edited:


You can install our site as a web app on your iOS device by utilizing the Add to Home Screen feature in Safari. Please see this thread for more details on this.
Note: This feature may not be available in some browsers.
then we have a good chance of retaking the 200-day by next week.
Agree. The retaking of the 200 DMA would mean to me that TSLA has become "don't care" with respect to the oil prices matter. Then they can also lower the oil price to $30, TSLA will have some troubles for some weeks but then TSLA will surge again like it's happening now. IMO investors are understanding that cheap fossil fuels are not good for the future of mankind.
 Now if only the rally would continue into Jan 17 '15, I'd be golden... :biggrin:
I took a flier on 202.50 Dec 20th on Monday and that's working out nicely so far, but only wish I had fired a few more bullets at that one. (It's not nearly enough to counteract my assuredly long lost 240s of the same date.)
I'm trying to figure out whether to cash these out today or whether we'll see a rally extension tomorrow. Any thoughts? Where IS that crystal ball when you need it?
I would cash them in now. If you want to bet on another big move tomorrow, you can buy some OTM calls (say, 220 or 225) with only an appropriate fraction of today's profits. You could tune it so that the net profit is in the same ballpark if you're right, but you get to lock in a big chunk if you're wrong, as opposed to losing it all.I took a flier on 202.50 Dec 20th on Monday and that's working out nicely so far, but only wish I had fired a few more bullets at that one. (It's not nearly enough to counteract my assuredly long lost 240s of the same date.)
I'm trying to figure out whether to cash these out today or whether we'll see a rally extension tomorrow. Any thoughts? Where IS that crystal ball when you need it?
Would love to see a chart with 200 day MA and 50 day MA so we could gain perspective on this move up. Oh keepers of the charts, cloaked in ye ancient arts of TA, share thine magic with us, and help us slay the dragon of FUD.
I took a flier on 202.50 Dec 20th on Monday and that's working out nicely so far, but only wish I had fired a few more bullets at that one. (It's not nearly enough to counteract my assuredly long lost 240s of the same date.)
I'm trying to figure out whether to cash these out today or whether we'll see a rally extension tomorrow. Any thoughts? Where IS that crystal ball when you need it?
The latest statement of Yellen was quite optimistic, as she believe the US economy is recovering and will be able to handle a normalization of interest rates. That was enough for investors to bid up stock prices, as it supported their narrative that the US recovery is strong and a reality.
CNBC reports that the first Battery Swap Station has opened (in a preliminary sort of way).