Do any of you F5-ers have the time to scratch back to learn what TSLA's all-time percentage change lists are? Today has to be somewhere in the top 5.


Welcome to Tesla Motors Club
Discuss Tesla's Model S, Model 3, Model X, Model Y, Cybertruck, Roadster and More.
Register
Install the app
How to install the app on iOS
You can install our site as a web app on your iOS device by utilizing the Add to Home Screen feature in Safari. Please see this thread for more details on this.
Note: This feature may not be available in some browsers.
-
Want to remove ads? Register an account and login to see fewer ads, and become a Supporting Member to remove almost all ads.
You are using an out of date browser. It may not display this or other websites correctly.
You should upgrade or use an alternative browser.
You should upgrade or use an alternative browser.
Tesla, TSLA & the Investment World: the Perpetual Investors' Roundtable
- Thread starter AudubonB
- Start date
ZeApelido
Active Member
Todd Burch
14-Year Member
Remember a few days ago when TSLA was the most shorted stock?
Yeah, that was a bad idea.
Yeah, that was a bad idea.
It took @T@oo four minutes to decipher it: Tesla, TSLA & the Investment World: the 2019-2020 Investors' RoundtableWild guess: 100-bagger for your entry?
What exchange rate is offered, TeslaPoints -> TSLA? Thanks.")
I dunno, in fact. Perhaps it took him 4m 12.414 sec.
Oh, _______. I have got to get some work done today.
Or do I?
Or do I?
ProfTournesol
Member
If I get another 6.4k I will donate it back and buy FSD
MartinAustin
Active Member
Well it has beat that volume list... it's an all-time trading volume high today and 2 more hours to go!!!
If you felt TSLA at $500 was a great short, imagine how you feel at $750!Remember a few days ago when TSLA was the most shorted stock?
Yeah, that was a bad idea.
Correlation between short interest on Tesla’s stock and the price from S3 Partners:
“Tesla short interest is $14.28 billion; 24.58 million shares shorted; 18.37% of its float; with a stock borrow fee of 0.30%. Short sellers have decreased their exposure by -1.78 million shares, -6.74%, over the last 30 days which equates to -$1.03 billion worth of short covering. There was active short covering ahead of Tesla’s earnings report yesterday, with 544 thousand shares covered, worth -$316 million, over the last week.”
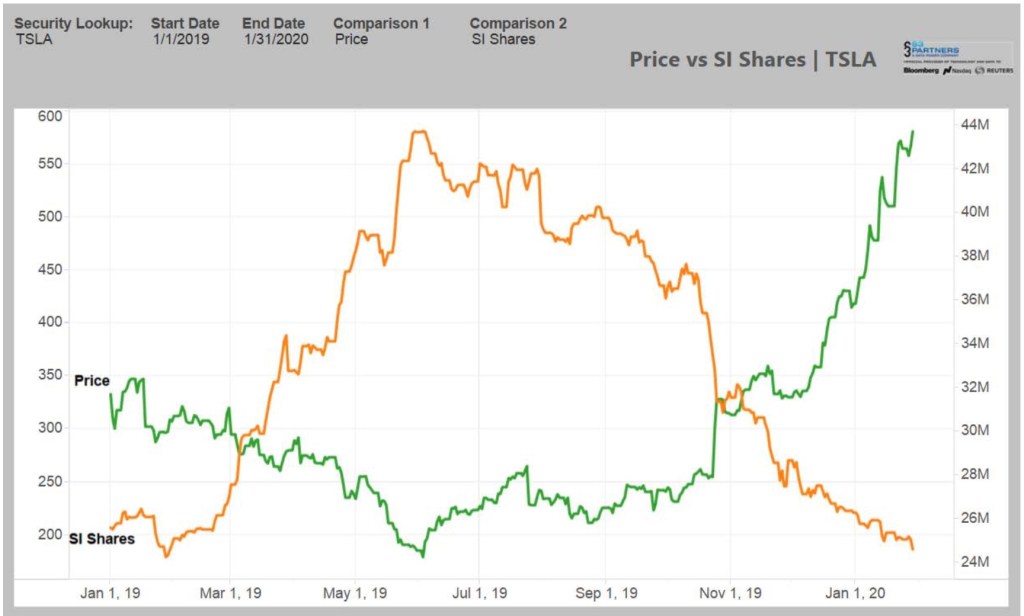
“Tesla short interest is $14.28 billion; 24.58 million shares shorted; 18.37% of its float; with a stock borrow fee of 0.30%. Short sellers have decreased their exposure by -1.78 million shares, -6.74%, over the last 30 days which equates to -$1.03 billion worth of short covering. There was active short covering ahead of Tesla’s earnings report yesterday, with 544 thousand shares covered, worth -$316 million, over the last week.”
Last edited:
For those unfamiliar VW was a two day squeeze. Tesla is a slow burn.
I agree. Probably worth a reminder what 2013 and the following years looked like. As the SP ran from $30-$100 shorts tended to cover. The SP continued to rise, undoubtedly fueled by buying, not short covering. By late in the year shorts came back in big numbers and helped temporarily push the SP down. But it didn't last long and the SP went back up and stayed up in a new range, while shorts got hammered a second time.
It did not resemble the VW squeeze in any meaningful way. (And yes shorts have been shorting low and covering high as long as $TSLA has been publicly traded
)TheTalkingMule
Distributed Energy Enthusiast
CNBC just covered today's big movers.....not a peep on TSLA. Lol!
Mike Ambler
Member
If we went back to $300 then I'd load up the truck with OTM leaps!!
You...and everyone else on this forum!
Just a little idle speculation: this rally bears no resemblance to The VW short squeeze, just looking at the charts side by side.
Today again, as in several of recent rally days, it looks like huge sell orders near the “top,” over 760, seemed to predict a sharp peak and imminent SP retreat. But not so, SP stabilized near 740, and began to slowly climb again, against high volume, showing considerable buy interest.
Large players, backed by industry interested parties, may have been engaging in naked shorting in the belief that they could control a rally or wait out a spike. For years this strategy has been very successful. Just six months ago, it looked unstoppable. As we heard from some of their “spokespeople” there was some belief that they could “kill” Tesla this way. But even if not to kill the company they could inhibit it in many ways, which seemed to succceding.
But at this moment it is musical chairs folks! Every time new longs take seats at the table now, these shorts lose chairs! So pressure rises very quickly! Very difficult not only to cover and hedge losses, but more importantly perhaps, it is now nearly impossible buy and control enough common shares to create the powerful sell events they have relied on to push the SP down, and inhibit rallies, as they have been accustomed to doing throughout the last several years. Now these strategies have likely moved well beyond budget, and are proving to be radically ineffective, because they actually contribute to the squeeze!
I would speculate further that these long established “manipulations,” along with activity on the part of MM’s to profit from TSLA volatility and high short interest over several years, have ironically served to “stabilize” this phenomenal rise, tempering sell offs with buy interest from new investors many of which will hold for longer than shorts can withstand the pressure to cover (attn: Jim Chanos).
I suspect this will go on for awhile. I heard one the sort of shell shocked “analysts” on CNBC last week say something like: “normally a big rise like this is followed by a significant drop, but not this time. It looks like they sort of stuck the landing.”
I though that was a hilarious reference to Spacex boosters!
Artful Dodger
"Neko no me"
You slacker. I'm waiting for $350.And sold my 5 remaining Jan 2021 $650's for $220 each - or 21900% profits
I suddenly have quite a lot of money (by my standards) to play with
Etna
Member
Do any of you F5-ers have the time to scratch back to learn what TSLA's all-time percentage change lists are? Today has to be somewhere in the top 5.
Top 10 change at close:
Date Change
20130509 24.4%
20101110 19.2%
20191024 17.7%
20181001 17.3%
20110331 17.0%
20120117 16.7%
20131203 16.5%
20180802 16.2%
20130401 15.9%
Top 10 volume:
Date Volume
20130514 37163896
20180928 33649694
20140225 32797000
20130716 32371868
20200122 31369028
20200108 31199393
20131106 31071726
20180807 30875768
20191025 30006091
Like this?Red and Stainless Steel
edit: added link to image.
See The Tesla Cybertruck In Flashy Hues: Rad Red, Bold Blue & More
Last edited:
The low price on the 2/7 $1000 calls today was $.01 per contract. They are currently trading at $1.45....
StealthP3D
Well-Known Member
Do any of you F5-ers have the time to scratch back to learn what TSLA's all-time percentage change lists are? Today has to be somewhere in the top 5.
Patience, my boy.
We have to get to the end of the day for that kind of stat! And, if you ask me, the price has been looking quite firm the last several hours! Maybe we will get an end-of-the-day pop?
Similar threads
- Locked
- Replies
- 0
- Views
- 3K
- Locked
- Replies
- 0
- Views
- 6K
- Replies
- 6
- Views
- 5K
- Replies
- 6
- Views
- 11K
- Locked
- Replies
- 27K
- Views
- 3M