Welcome to Tesla Motors Club
Discuss Tesla's Model S, Model 3, Model X, Model Y, Cybertruck, Roadster and More.
Register

Tesla, TSLA & the Investment World: the Perpetual Investors' Roundtable

This site may earn commission on affiliate links.
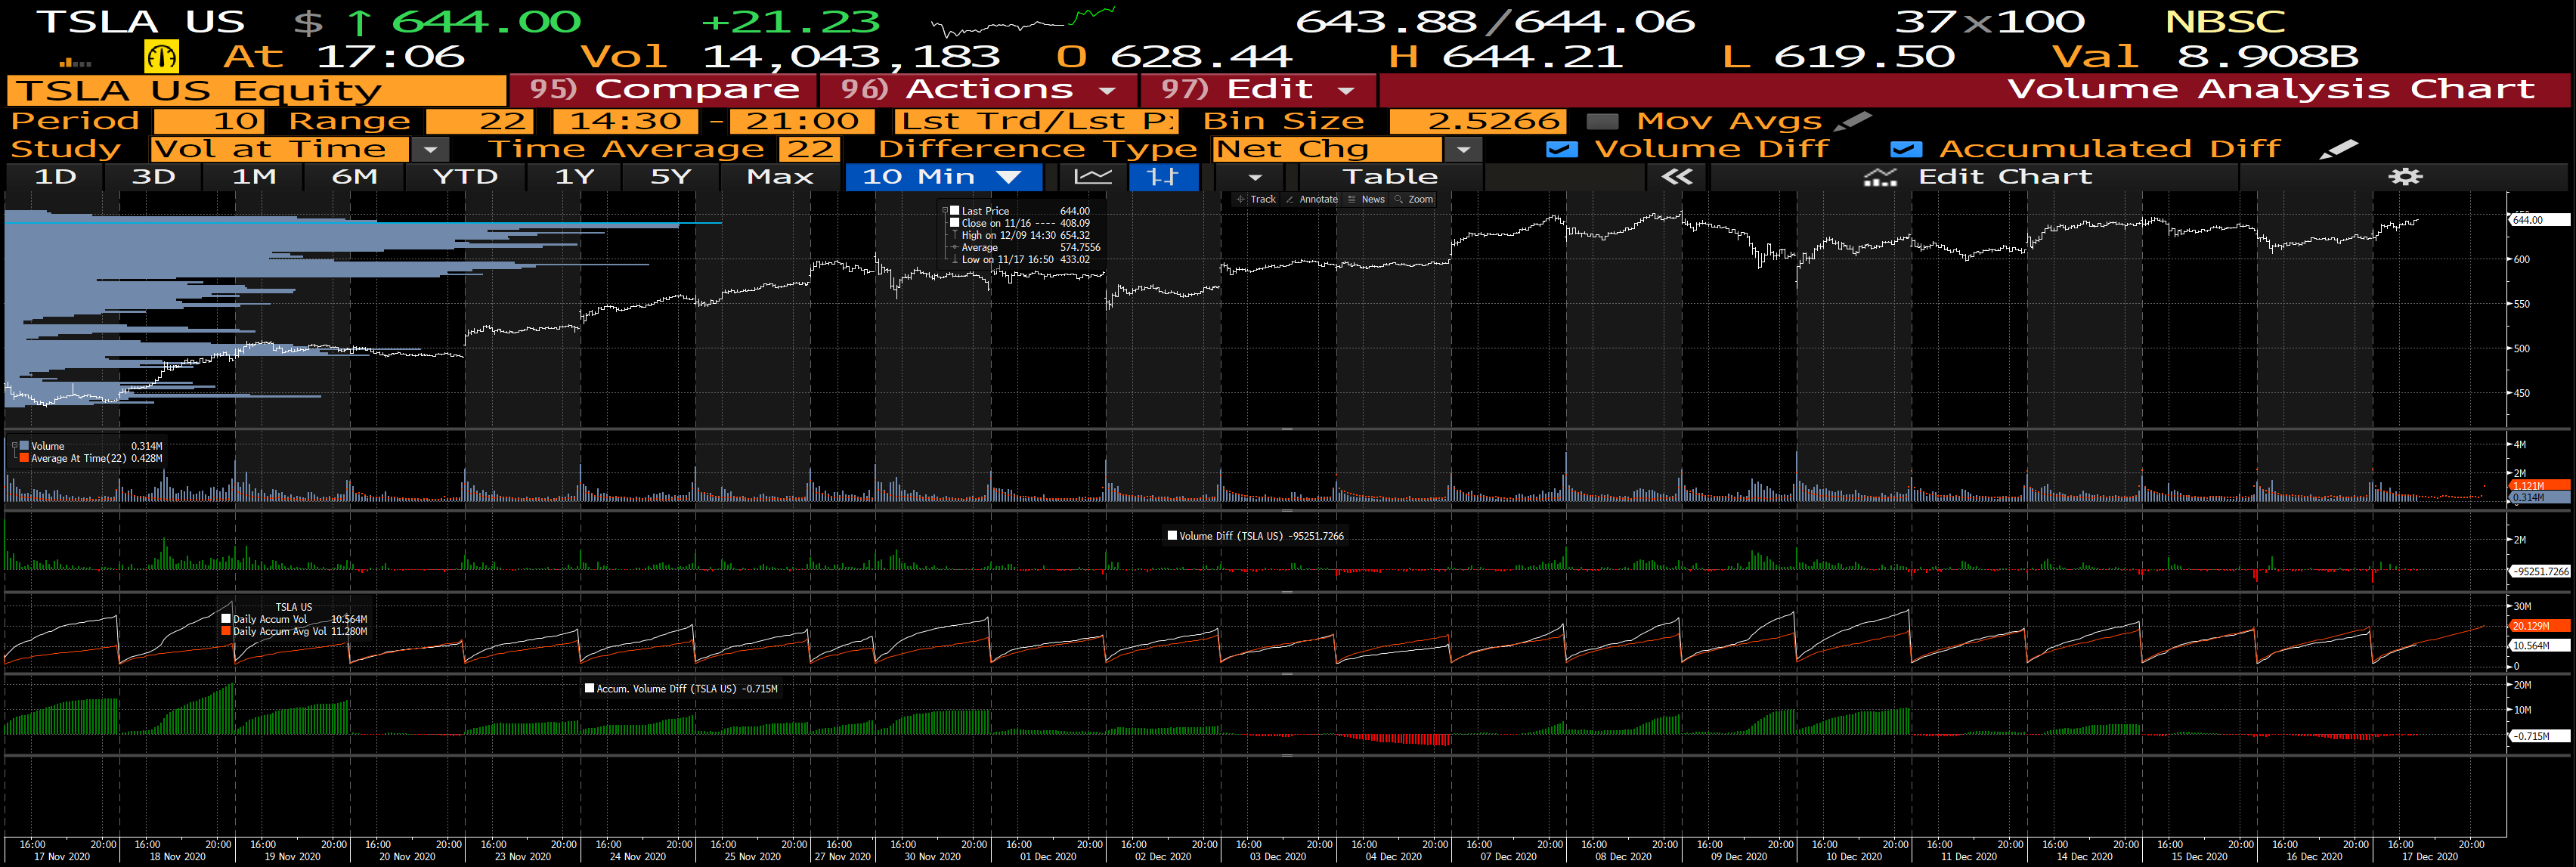
How is per-hour volume looking compared to yesterday? Seeing any sort of uptick that would support the idea that index funds are starting to buy?

It's a little higher, but nothing crazy. The few times that there was clear buying, volume was somewhat high, but in between there were many prolonged periods just as quiet as most of yesterday.

We're still not at 25M shares for the day. I'd guess that at this pace we might end up at volume of 60M or 65M.
 
i'm not buying any of this closing cross malarkey.

After reading more about it and watching some videos, I see it as a valid way to grab some shares at a guaranteed price. However, I'm very sceptical that 120m+ shares will be offered by sellers via this mechanism - just doesn't make sense for those looking to maximise gains.

Anyway, guess we'll see in 28 hours or so!

Now all depends on how many shares have been front-run, <120m, price goes up, >120m price goes down, ~120m price will remain around $600

I'm all for this being the new flooring in to 2021, we're already blessed.
 
This isn't a rationale for buying/selling/holding, it's more like an emotional defense mechanism or simply a rational conservative mindset.

We all know anything can happen, but if you're looking for a rationale for decision-making......16% of the TSLA float is about to be purchased and effectively locked in a box forever. No one should have to apologize for thinking that will cause some rapid share price appreciation followed by a decline. It's just simple logic.

Yes, dark pools of both normal and nefarious players could provide $78B+ worth of shares in one fat injection on Friday afternoon, but somehow I doubt it.
I never said don't expect a spike. I'm just saying it's not guaranteed and if it doesn't happen, it's not necessarily due to some nefarious reason.
 
I admit he is great for entertainment, however if he truly has no real 'company' that manages $ or does any business, it is just shady AF to keep getting paychecks from big oil to dump on Tesla. I guess everyone has their price to sell their soul, however, you could not pay me enough to constantly make a fool of myself on national television. I guess it is ok if you live in your parent's basement :)

I will admit that I have enjoyed some of Gordon Johnson's nonsense for quite sometime!

The last time he was on yahoo finance I tried watching it and it actually made me sick to my stomach and I couldn't finish it.

someone needs to Investigate whether he is being paid by the oil companies for his nonsense and why yahoo features him time and time again.
 
My psychic or psychotic self says we cross 650 today.
The same thing we try to do every day HG, try to take over errr I mean cross $650.
I will admit that I have enjoyed some of Gordon Johnson's nonsense for quite sometime!

The last time he was on yahoo finance I tried watching it and it actually made me sick to my stomach and I couldn't finish it.

someone needs to Investigate whether he is being paid by the oil companies for his nonsense and why yahoo features him time and time again.
Yahoo editors and management must be short on Tesla. They are always very negative.
 
This one seems macro related, or at least boosted by macros. Overall markets are up alongside TSLA over the past 5-10 min, although TSLA is of course amplified as usual:

TSLAamp.jpg
 
After reading more about it and watching some videos, I see it as a valid way to grab some shares at a guaranteed price. However, I'm very sceptical that 120m+ shares will be offered by sellers via this mechanism - just doesn't make sense for those looking to maximise gains.

Anyway, guess we'll see in 28 hours or so!

Now all depends on how many shares have been front-run, <120m, price goes up, >120m price goes down, ~120m price will remain around $600

I'm all for this being the new flooring in to 2021, we're already blessed.

Those with Level 2 access to this information will know almost right away at 3:50 PM PT tomorrow what the on-close order volume looks like.
 
Thanks for quoting that post, I definitely missed it the first time. While I subscribe to the overall idea I’m having a tough time with this particular aspect of this idea “However, if big firms can bring their own shares to the pool and let market pricing sort it out”. The scale of the shares that need to be traded is somewhat astronomical given the market’s conviction in Tesla. Hence my skepticism with this theory.

Why would the big firms want to give up their Tesla shares? Why would anybody want to give up their shares? Maybe I’m answering my own question but it is very interesting that ARK continues to be overweight TSLA. Is it possible they have a deal with one of the funds for a confirmed price no matter what? Is that even allowed? Man it would need a whole lot of coordination between these big firms to pull this off.

I think people are trying way too hard to make predictive sense of all of this. There are far too many things that we can't see to every hope to pull the parts we can see together in a manner that really moves the needle in terms of having a reasonable idea of how this will all play out. Sometimes it's just better to know that you can't know.

But to jump back into the rabbit hole, the idea of large blocks of shares being able to be exchanged between funds at current market prices is just one small part of the puzzle - I don't think anyone presented it as critical to understanding how this will play out. The important idea is this - that there are multiple relief mechanisms that, when added together, could take significant pressure off a squeeze to the stars. What it really comes down to is how the balance of buyers and sellers plays out. And due to the amount of high-frequency trading that occurs constantly, the number of shares that have traded hands is not a metric that can speak to how this balance will play out. It's really impossible to know except to say as the price rises more sellers will appear and it's unlikely to turn into an "infinity squeeze." And the possibility exists there won't even be small squeeze, we cannot know.

It would be like trying to tell if your car's tire has a leak while listening for a small hissing sound by the side of the highway as three lanes of traffic are whizzing by at 75 mph. Utterly useless. You can't learn anything from that. It's better to look at the shape of the tire and know that all you can know is that, if it is leaking, it's not flat yet! Unfortunately, we don't even have a tire pressure gauge. It's not a good idea to declare there is probably not a leak because you can't hear one! It's better to know that even if there was a leak you wouldn't be able to hear it.
 
You're about to see a single tear run down my cheek as my last $90 sold put position gets closed out. Been stubbornly holding out to save $12, and I think we're about there. So many feelings.

I knew nothing of options 5 years ago, got waaaay too into them with SCTY way too early. Now that I've had some time to watch things and dabble a bit more, I greatly prefer selling calls/puts. A much easier game if you ask me.
 
38cc4b8bc170b5f5d12672b3382fc91d.png

Volume at time chart. Average volume benchmark set to last 22 trading days.

top: price
2nd: grey bars traded volume, orange dot average volume.
3rd: green bar= higher than average, red bar= lower than average at that timeframe.
4th: red line is average accumulated volume at time. White line is actual accumulated volume at time.
5th. Accumulated difference in volume at time.

Hope it's helpful.
 
I think people are trying way too hard to make predictive sense of all of this. There are far too many things that we can't see to every hope to pull the parts we can see together in a manner that really moves the needle in terms of having a reasonable idea of how this will all play out. Sometimes it's just better to know that you can't know.

But to jump back into the rabbit hole, the idea of large blocks of shares being able to be exchanged between funds at current market prices is just one small part of the puzzle - I don't think anyone presented it as critical to understanding how this will play out. The important idea is this - that there are multiple relief mechanisms that, when added together, could take significant pressure off a squeeze to the stars. What it really comes down to is how the balance of buyers and sellers plays out. And due to the amount of high-frequency trading that occurs constantly, the number of shares that have traded hands is not a metric that can speak to how this balance will play out. It's really impossible to know except to say as the price rises more sellers will appear and it's unlikely to turn into an "infinity squeeze." And the possibility exists there won't even be small squeeze, we cannot know.

It would be like trying to tell if your car's tire has a leak while listening for a small hissing sound by the side of the highway as three lanes of traffic are whizzing by at 75 mph. Utterly useless. You can't learn anything from that. It's better to look at the shape of the tire and know that all you can know is that, if it is leaking, it's not flat yet! Unfortunately, we don't even have a tire pressure gauge. It's not a good idea to declare there is probably not a leak because you can't hear one! It's better to know that even if there was a leak you wouldn't be able to hear it.
16% of the float is about to be purchased and locked asway essentially forever. We know this.
 
The only example in the modern market I'm aware of that was an actual infinity squeeze was VW. (certainly the most famous, I suppose there might be others I'm unaware of)

The reason that can't happen here has already been covered a number of times.

(unlike VWs squeeze, for example, the # of shares needed for TSLA exist in the float- they didn't for VW until Porsche decided to release the pressure and add some of theirs, so even at a price of infinity demand could not be met before then)

So it'd be nice if people stopped using that word. It does not mean what they think it means.
 
  • Like
Reactions: transpondster
38cc4b8bc170b5f5d12672b3382fc91d.png

Volume at time chart. Average volume benchmark set to last 22 trading days.

top: price
2nd: grey bars traded volume, orange dot average volume.
3rd: green bar= higher than average, red bar= lower than average at that timeframe.
4th: red line is average accumulated volume at time. White line is actual accumulated volume at time.
5th. Accumulated difference in volume at time.

Hope it's helpful.

Do you have access to historical closing cross volume? I checked Market Chameleon, but they only track imbalances > 50,000 shares. Thought it would be interesting to see what closing cross volume is like on quadruple witching days.