Welcome to Tesla Motors Club
Discuss Tesla's Model S, Model 3, Model X, Model Y, Cybertruck, Roadster and More.
Register

TSLA Technical Analysis

This site may earn commission on affiliate links.
You know how sometimes you draw on a chart after the fact and are like "damn, I wish I traded that but its all good"? And then other times you can't believe you missed the obvious telegraph?

The early March bottom in the mid 500's is the latter. :mad:

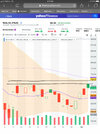
Anyway, we're fixin on potentially an ascending triangle in the short timeframe and a symmetrical in the mid timeframe, both using the same uptrend TL. If we break the ascending quickly we may see a run up to the high 700's, but I'd bet that the symmetrical will hold. If the ascending holds over the next day or three then I see price testing the uptrend, down in the low 600's.

View attachment 651103
Really appreciate your analysis. My simple, flat-line mind says that somebody really doesn’t want the SP to get above about $715.
 

Attachments

  • 03BBA014-96C7-4330-81FC-9E4163443155.jpeg
    03BBA014-96C7-4330-81FC-9E4163443155.jpeg
    304.2 KB · Views: 91
My simple, flat-line mind says that somebody really doesn’t want the SP to get above about $715.

That's a pretty solid assessment. I'm drawing a slight downtrend line on what you're seeing (as opposed to a horizontal line), but its basically the same thing. 50MA will also provide converging resistance around the low-700 price point over the next few days. If we break to the upside we may see some resistance from the one downtrend line I have drawn, but I suspect we're more likely to go up to the high 700's. Breaking higher that will likely require some material fundamental news.

On the downside 20MA has been propping up the past few days. If we break below 20MA I'd expect to drop down to the shallower of the two TLs I have drawn, which will correlate to some price volume support in the low 600's. A more agressive/speculative long entry would be if the steeper of the two TLs is confirmed with a touch/reversal. If that happens we'll really be setting up for a nice ascending triangle with 'your' horizontal line.

1618003411766.png
 
Technical analysis, price predictions and news on Tesla stock for week ending 04/10/2021. Tesla is showing difficulty breaking above resistance at $680. If it continues to trade below this level, Tesla could be headed down to retest support at around $600. To the bull side, if Tesla can break above $680 resistance, we could easily see it testing the 50DMA at around $718. A break above that, and we would see test of resistance at $736 fairly quick.

Tesla news this week includes:
  • Wedbush upgrades Tesla to outperform
  • Morgan Stanley recognizes Tesla’s disproportionate advantage over legacy automakers
  • Biden plan calls for $100 billion in new EV consumer rebates
 
Do you really think “they” will allow TSLA to reach that level? I’m positioned for a breakout, but I’m really expecting that the SP won’t exceed 708 tomorrow, followed by another pushdown, probably below 700 again. Alas, someday my Prince will return.
 
Seems to me that these classic technicians support my technical viewpoint. Source IBD

View attachment 653278
TSLA had not been above its 50-day SMA (simple moving average) since February 19th. But it opened there this morning, then surged well above. This can be considered a bullish technical signal, if it holds into today's close. :cool:
 
TSLA had not been above its 50-day SMA (simple moving average) since February 19th. But it opened there this morning, then surged well above. This can be considered a bullish technical signal, if it holds into today's close. :cool:
TSLA surged above its 50-day SMA (simple moving average) yesterday, and remained nicely above today despite the pullback. If it again closes above that level tomorrow, that may be considered a welcome technical sign.
 
Technical analysis, price predictions and news on Tesla stock for week ending 04/17/2021. Tesla tested a key level several times this week and will need to stay above $724 to remain bullish. If we can trade at $724 and above, I can see Tesla making its way up to $820 resistance. A break above that and we could see Tesla back near all time highs. To the downside, if we break below $724, we’ll see a test of the 50DMA at around $707. If it breaks down further, we will likely see $672.

Tesla news this week includes:
  • Elon Musk: “..going to moon very soon” Dogecoin? TSLA? SpaceX?
  • Tesla stock tokens begin trading on Binance crypto exchange
  • Canaccord: Upgraded TSLA to buy, boosting PT 155% to $1,071
  • Tesla Cybertruck has surpassed 1 Million reservations according to Reservation Tracker
  • India urging Tesla to start manufacturing EVs in India
 
I don't know, I've got a bad feeling about this earnings report.

Don't get me wrong, I think Tesla will knock the numbers out of the park, but with regards to the SP and market I'm not sure we're going to see the kind of bump upwards we would all like to see. I've got this nagging feeling the volume won't be there to counter the MM's controlling the price and holding it down where they want it. Maybe in a few weeks it gets away from them, maybe a few months, but for the foreseeable future I have this feeling we are stuck kind of flat-ish.
There could be more than just a 'hunch' to support your 'nagging feelings' that we trade sideways for a few more weeks. Last week TSLA broke through the monthly support trendline with the help of some much-needed FUD to facilitate such a move. The result was to once again keep it in a well-formed 'wedgie' (converging trendlines) shaped by the more influential 3-month and the 1-year trendlines. The convergence of this sideways trading around the 700-level could be another month away unless we can break above the 3-month with the earnings report next week...........or of course if the FUD can get piled high enough to weigh down TSLA sufficiently to fall below the longer 1-year trendline. When TSLA breaks through either with conviction (i.e. TSLA closes sufficiently above or below - no 'head fakes') it will lead to another quick 20% or more move IMO, as we have almost always witnessed in the past. We recently witnessed a similar move upwards when TSLA double bottomed off the 1-year trendline (~600 for a >120 point move).

Edit - It is the 3-month trendline that is 'coiling the spring'. However, it is the 1-year trendline that has been raising the elevation from which that spring eventually uncoils rapidly from.

1619032464502.png
 
Last edited:
TSLA running up hard towards the upper 3-month resistance and then taking a breather this morning......that level is approximately 742-ish. A nice setup by MM's prior to Monday's earnings call would be to put TSLA just below the 3-month resistance line. Then if TSLA provides blow-out earnings the stock has a clear run to the mid-800's. And if the Market is underwhelmed by the news, then TSLA can continue to drift above the 650 support of the 1-year trendline as it slowly continues to rise from a longer perspective. TSLA made some shorter-term traders a lot of money last year on its epic run when it traded back and forth between wedges in the channels

1619189811674.png


1619189917468.png
 
Technical analysis, price predictions and news on Tesla stock for week ending 04/24/2021. Tesla traded indecisively this week as it bounced back and forth from bearish to bullish outlooks. It has been trading within a consolidation range between $700 and $775, I anticipate a breakout post-earnings. The picture is slightly bullish with the MACD and RSI looking positive. Also, Tesla is trading above the 50DMA for just over a week now. The longer we hold above this level the more bullish the outlook going forward. To the downside we have support around $695. A break below this and we could see $665. To the bull side, we have resistance at $775. A break above this and we could see $830.

Tesla news this week includes:
  • SpaceX wins $2.9B bid for NASA’s lunar lander system, beating Jeff Bezos’ Blue Origin
  • Tesla Autopilot approaching 10 times lower chance of accident than average vehicle
  • Crash involving driverless Tesla vehicle; media spreading FUD

 
Video in a new "JP Strategic Investments" Youtube channel comparing the 2021 triangle with that of the Q3 2020 triangle and Q1 2020 triangle.

Tl;dr:
Blue line is the quarterly earning's day.
Yellow line is the end of the triangle where Q1 2020 rise was driven by the 5 for 1, and the Q3 2020 triangle driven up by the S&P inclusion.

His conclusion: if the 2021 Q1 triangle continues to form over the next few days/weeks then that upcoming yellow line may be a good time to buy some options.


Screenshot 2021-04-24 at 5.38.26 PM.png


Last edited:
Craig Johnson is the technical market strategist at Piper Sandler and was a guest of mine on my old TV show. In early 2013 he recommended TSLA, which led to my first purchase. Earlier this year he was slightly bearish on TSLA. But this morning he wrote:

Tesla Inc (TSLA - $738.2); Indicated lower this AM: Shares have confirmed support off the lower end of a rising price channel; above the rising 40-week MA; RSI has inflected higher off the midline; add to positions, a retest of the ‘21 highs near $885 appears likely.
 
So far today Tesla's 50-day SMA (simple moving average) has continued to prove supportive, just as it has since April 13th.

I would love to see a close just above the 50-day EMA (704; or higher, but i'm happy to not be greedy ;)) to cement the bullish trend shift, now that we finally have 5/10/20/50/100 EMAs almost all stacked. Just need the pesky 5/10 to flip again.
 
I would love to see a close just above the 50-day EMA (704; or higher, but i'm happy to not be greedy ;)) to cement the bullish trend shift, now that we finally have 5/10/20/50/100 EMAs almost all stacked. Just need the pesky 5/10 to flip again.
Agreed. However, in my experience an SMA (simple moving average) has proved more useful than an EMA (exponential moving average). To me it is somewhat pointless with an EMA to dilute the results of earlier dates of a moving average. For that purpose one might as well use a shorter term SMA, or compare SMAs of several lengths. The current 50-day SMA for TSLA is $690.
 
Technical analysis, price predictions and news on Tesla stock for week ending 05/01/2021. Tesla turned bearish during the week, but had a strong bullish close to end the week. It broke back above the 50DMA after closing below this level for only one trading day. It has also moved back into the consolidation zone between $700 and $775. If it could hold above $685, we could see it rally back to resistance at $775. A breakout above that and we could see it continue to run up to around $840. To the downside, a break below $685 and we could see Tesla fall to around $655. If it continues to fall, the next level of support comes in at around $633.

Tesla news this week includes:
  • Tesla Q1 Earnings Results
  • Elon Musk to host ‘Saturday Night Live’
  • Elon Musk: FSD Beta V9.0 will blow your mind
  • Limited FSD Beta V9.0 to release in two weeks
 
  • Informative
Reactions: wanaxnow