Welcome to Tesla Motors Club
Discuss Tesla's Model S, Model 3, Model X, Model Y, Cybertruck, Roadster and More.
Register

TSLA Technical Analysis

This site may earn commission on affiliate links.
Some buying with volume has been coming in during this hour for TSLA. I see no fresh positive news, which was essentially the case during the big up move on Friday.

This takes TSLA back above its 50-day SMA (simple moving average) of $684, which had been supportive for a while, but was pierced to the downside earlier today. Closing above that SMA could be encouraging.
 
Alternative TA explanations:
1. The 50 day average is still declining-bearish
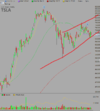
2. There appears to be a rising wedge pattern forming. Which way does it normally break out?
 

Attachments

  • ta.PNG
    ta.PNG
    43.5 KB · Views: 64
Was really hoping there'd be some support from the recently confirmed uptrend line (the steeper of the uptrends) combined with the price-volume accumulation zone between ~670-680, but it doesn't look like that's happening. 50MA provided resistance this morning. Will be interesting to see if there's a recovery today above that TL, otherwise the next decent support is going to be when price meets the shallower uptrend line, maybe around 635-640. The good news is that will really solidify the symmetrical triangle.

1620145499607.png


The good news is that potential 635-640 support correlates to the bottom of the strong longer term price-volume range (the highlighted bar on the histogram starts at 637).

1620145946979.png
 
Last edited:

@bxr140

Are you fluent with Elliot Waves? I was thinking the $630 level too when I bought some puts as insurance two weeks ago, but at the moment I think we might correct down to $500's. Do you have any opinions/insights?

(I am a complete noob when it comes to TA and charting, so please don't make fun of me lol)

1620147091988.png


@bxr140

Are you fluent with Elliot Waves?

No, just a general understanding. They never really resonated with me which is why they're not part of my go to (my go to is accumulation/distribution zones, trendlines, and industry standard MAs). That said, I also am of the mindset that everyone has their own set of go-to tools for technical analysis, and IMHO TA isn't about the specific method one uses but rather the statistical viability of their overall strategy. If Elliot Waves resonate with you and you can make them statistically work, that's awesome and you should keep using them.

...And then you can sell me on them because I'm always looking for ways to strengthen my analysis. 😁
 
  • Like
Reactions: bballshinobi
Here's a start. Bigger picture the theory is rooted in institutional volume, and that resonates with my brand of technical analysis which is very much "just try to do what people smarter than you are doing" as opposed to coming up with some whiz bang thing where I'm on my own. So search for things like "institutional accumulation", "accumulation/distribution zones", and "supply/demand zones".

FTR I don't use the A/D indicator. I look for ~small candles with ~small wicks, which are potentially an indicator of a good amount of volume in a small price range and relatively short period of trading (say, 3-4 days max), and I'll verify volume in those zones by switching my X axis from daily candles (which is my standard timeframe) to volume based candles. If the volume candles are also small in those time periods, that's a good sign. FWIW I'm currently using 17M share candles, as that's ~1/2 of ~current average volume (which has risen to ~37M from ~34M when I last reset my candle width), though the actual candle width really doesn't matter that much in context of how I'm using it. I do this analysis in my primary platform, Tradestation.

I'll also supplement that analysis with the longer term price-volume histogram that's pretty convenient from Fidelity (the second screenshot from above). This gives me a bigger picture look at where we really are and what kind of institutional actions may be coming.
Thank you sir!
 
Barron's - nearly an hour ago: Tesla Might be Due for a Bounce

Excerpt:

...That’s because Tesla stock is starting to look oversold when considering other technical metrics, such as relative strength. Such technical indicators look at the number and magnitude of gains and loss for a stock or an index. When stocks are oversold it can mean, to technical traders, that all the bad news is priced into a stock...
 
  • Like
Reactions: bxr140
50MA slapdown today after a weak trend line break. Mid 600's price volume seems to be the only thing propping up TSLA right now. No real good entry points from my armchair unless we 1) can break through the top side of the symmetrical triangle at ~750 (and falling), which will require price to also push through resistance from the ~740-750 consolidation zone from a ~2 weeks ago or 2) confirm the bottom side of the symmetrical triangle in the ~640-650 range (which as noted a few posts up is the bottom of the current price-volume spike.)

1620417906840.png
 
50MA slapdown today after a weak trend line break. Mid 600's price volume seems to be the only thing propping up TSLA right now. No real good entry points from my armchair unless we 1) can break through the top side of the symmetrical triangle at ~750 (and falling), which will require price to also push through resistance from the ~740-750 consolidation zone from a ~2 weeks ago or 2) confirm the bottom side of the symmetrical triangle in the ~640-650 range (which as noted a few posts up is the bottom of the current price-volume spike.)
Indeed, the downward sloping 50-day SMA has proven resistant in recent days. However, the upward sloping 150-day SMA has remained supportive for two months. Next week we may learn which one is more determinant.
 
  • Like
Reactions: bxr140
Technical analysis, price predictions and news on Tesla stock for week ending 05/08/2021. Tesla showed further weakness this week as it gradually drifted lower. It dropped below key support of the 50DMA and is now trading below it for several days now. To the downside, there is considerably strong support at around the $640 level. I would be really surprised if Tesla broke below this level. If it does break below, it would be breaking a long term uptrend that it has been trading in since August 2020. The next keys support would come in at around $576 which is the 200DMA. To the upside, Tesla will find resistance at the 50DMA at around $680. A break above this level and we are likely to see Tesla make a higher high. But first it must break the $700 level, then breakout above its previous high at around $775.

Tesla news this week includes:
  • Miami Mayor Suarez sees Tesla Robotaxi launching there as early as 2022
  • Tesla demand is through the roof, already sold out this quarter
 
We've only ever closed below the 150 SMA (currently 644.81) once since announcing S&P inclusion. On March 18, 2020.

The lack of volume doesn't make me particularly confident that we won't be seeing the 200 SMA (578)
I think we are due for a deep correction. Tech is dropping even though S&P 500 hasn't corrected yet. Let's say we get the 200 day MA (~$580) and then the S&P corrects 5-10%, we can see $400's before this is all over.
 
  • Informative
Reactions: bxr140
Darn, I was just about to ask you for your assessment. I’m assuming that 600, and maybe even 550, is now in play.

Yeah. I'm looking at the price volume around 600 as support, which may also line up with 200ma. But...I'm also a little worried about the macro tech dump right now, and the mid term possibility of a pullback. In the short term if there's a pro gap on the short timeframe trend line below, I'll go in. If we get a bullish maubozu pair (big red followed by big green, little or no wicking) I may also go in.

1620675660976.png


10M share candles, no adjustment to any of the drawings on the above daily chart other than muting the MAs.
1620676242484.png