Welcome to Tesla Motors Club
Discuss Tesla's Model S, Model 3, Model X, Model Y, Cybertruck, Roadster and More.
Register

Near-future quarterly financial projections

This site may earn commission on affiliate links.
Why do you think solarcity revenues will decline from $123M to $103M in Q3? There was a re-launch of the solar panels in the middle of the quarter. Any significant bump in this would wipe out the projected $28M loss.

Yes, I am also wondering about this, more specifically the solar leases, how they are funded, and how much revenue increases...

Also the may be able to recognise some deferred FSD revenue... it is impossible for a model to account for all of these unknowns...

Deliveries were slightly lower than I expected as Model 3 production was slightly lower than I hoped for, that implies lifting production rates can take time...

Q4 China is making some cars, and Solar can help lift revenues ..
 
Last edited:
  • Like
Reactions: deffu
the s/x asp the way it is calculated in my model is everything in auto that is not model 3, leasing, credit, or known-one timer divided by units. it is not merely s/x revenue divided by units. so that number i estimate for s/x asp should always be higher than the true s/x asp (which afaik is not reported anyway).
.
CARB's annual ZEV credit report will be out in two weeks. The FCA contribution is an enigma, (as Deepak was wont to say): "I don't think we have decided to disclose that level of granularity." Less information = more volatility--place your bets. It's not about whose projections are closest--it's about who can best discern how Mr. Market will react.
 
solar mw deployed have dropped every quarter on a y-o-y basis every quarter since the solar city acquisition.
solar mw deployed has also dropped q-o-q each of the last 3 quarters.

i'm going with the trend is my friend and saying mw deployed are dropping q-o-q again, and taking revenues along for the ride. i will gladly accept an upside surprise.

there are also other levers they could pull to get to non-gaap profits.

any forecasting effort is a balance of many factors, any of which could be estimated incorrectly. i try to get the overall picture approximately right without getting too lost on the estimation of any specific detail. the solarcity split i keep is largely educated guesswork with a shaky foundation in reality.

Why do you think solarcity revenues will decline from $123M to $103M in Q3? There was a re-launch of the solar panels in the middle of the quarter. Any significant bump in this would wipe out the projected $28M loss.
 
solar mw deployed have dropped every quarter on a y-o-y basis every quarter since the solar city acquisition.
solar mw deployed has also dropped q-o-q each of the last 3 quarters.

i'm going with the trend is my friend and saying mw deployed are dropping q-o-q again, and taking revenues along for the ride. i will gladly accept an upside surprise.

there are also other levers they could pull to get to non-gaap profits.

any forecasting effort is a balance of many factors, any of which could be estimated incorrectly. i try to get the overall picture approximately right without getting too lost on the estimation of any specific detail. the solarcity split i keep is largely educated guesswork with a shaky foundation in reality.
Solar revenue has two parts:
1. Lease/rent. Mostly priced per kWh. I estimate quarterly is 60m, 100m, 100m, 60m due to summer/winter output variation.
2. System sales - was $3 per sold W, now 2.50-2.75.

The new rental scheme is an experiment. Revenue is ~4 cents per rented W per quarter. If they rented 20 MW on the first day of Q3 that'd be 0.8m revenue. Average deal would be mid-month, though, so 0.4m revenue in Q3 and 0.8m in Q4 and all subsequent quarters. It will take years to build the rental revenue stream to a meaningful level.
 
this may call for an update on my side. do you have a reference for this? i do a linear estimate from mw installed and i've felt my method is incorrect due to the price per mw being absurdly high now.

another question, using your estimation could you determine if storage margins were positive last quarter?
There is no single source - I patched this method together using old SCTY slide decks plus pricing info from Tesla's website and SEC filings. I generally use $3/W for solar system sales and $0.50/Wh for Powerwall/Powerpack sales. For solar leasing I used 1300 annual kWh per installed kW and 13 cents per produced kWh. The solar lease portfolio is 6+ billion, but a lot of that was installed at 3.25-3.50/W so it's a bit less than 2 GW in total. This matches reasonably well with SCTY's cumulative deployment data, most of which went into the lease portfolio until the crash/bailout.

~2 billion watts installed * 1300 Wh/W * 13 cent/kWh = 338m annual solar lease revenue

Since the portfolio is probably a bit less than 2 GW and I like round numbers, I assume 320m annual revenue. I just made up the ~60/100/100/60 quarterly split. It seems to track results reasonably well. EIA shows distributed solar produces about twice as much in July as January, so I'm in the right ballpark. Using my rough assumptions Q2 breaks down as follows:

100m - solar leasing
60m - solar sales (29 MW installed * 70% sale/loan ratio * $3/W)
208m - storage sales (415 MWh * $0.50/Wh)
---------
368m - total

Solar historically had ~30% gross margin, which gives Q2 COGS of:

70m - solar leasing
42m - solar sales
213m - storage sales
---------
325m - total

Using these assumptions storage gross margin is slightly negative. I just call it breakeven, since 5m is well inside my margin for error.
So, are you guessing for solar we should expect similar revenue/cogs to Q2 ?

How about storage. Do you think it will go up in Q3 ?

In terms of total revenue, my model says Q3 will be $100M less than Q2. Market won't like that. @luvb2b shows about $130M less than Q2. Yahoo analyst average shows $6.38B, which is slightly higher than Q2.
 
i thought about my numbers again.
units are up slightly but more than offset by the combination of higher leasing and lower asp. that's what i am staying with.

perhaps deferred revenue, storage, service, or credits will provide a greater jolt than i guessed but i'm not counting on it.

i think the reasonable money is on a q-o-q revenue decline.

i can hope for better but it's only hope.

however i think on earnings the street is a bit low.

So, are you guessing for solar we should expect similar revenue/cogs to Q2 ?

How about storage. Do you think it will go up in Q3 ?

In terms of total revenue, my model says Q3 will be $100M less than Q2. Market won't like that. @luvb2b shows about $130M less than Q2. Yahoo analyst average shows $6.38B, which is slightly higher than Q2.
 
i think the reasonable money is on a q-o-q revenue decline.
Yes - I think if the analysts averages remain the same - we will see a beat on eps but a miss on revenue.

Given the higher lease %, the analysts should revise their numbers downward for revenue. We'll see where we are in 3 weeks.

Current Yahoo numbers are :
EPS (non-gaap) : -0.41or ~ $70M loss.
Revenue : $6.38B


Terminal is at

Revenues: 6.35B Only 7 out of 23 updated since p&d report
Net Income (non-gaap): -72mil
Net Income (GAAP): -211mil
 
So, are you guessing for solar we should expect similar revenue/cogs to Q2 ?
Basically. Q3 should have 100m solar leasing revenue and as a guess I'd say cash/loan sales will be similar to Q2. Unless the new rental program stole cash/loan customers, that is.
How about storage. Do you think it will go up in Q3 ?
It should grow 50-100m since Tesla guided 2 GWh for the year (and Musk said 3 GWh). But they didn't say much about storage in the Q2 letter, so it's just guesswork.

I agree that unless they pull an emissions credit or deferred revenue rabbit out of the hat, Q3 revenue will be down slightly from Q2. I'm very interested in Q3 vehicle COGS. They improved more than I expected in Q2.
 
  • Informative
Reactions: Fact Checking
i thought about my numbers again.
units are up slightly but more than offset by the combination of higher leasing and lower asp. that's what i am staying with.

perhaps deferred revenue, storage, service, or credits will provide a greater jolt than i guessed but i'm not counting on it.

i think the reasonable money is on a q-o-q revenue decline.

i can hope for better but it's only hope.

however i think on earnings the street is a bit low.

What makes you think ASP is lower? Are you referring to all models or just S&X or just 3?

I recall seeing an analyst note out of Europe the other day where they said they had met with tesla who said ASP had stabilised around ~$50k (It always bother’s me about how this is legal)
 
  • Informative
  • Like
Reactions: kbM3 and EVNow
solar mw deployed have dropped every quarter on a y-o-y basis every quarter since the solar city acquisition.
solar mw deployed has also dropped q-o-q each of the last 3 quarters.

i'm going with the trend is my friend and saying mw deployed are dropping q-o-q again, and taking revenues along for the ride. i will gladly accept an upside surprise.

there are also other levers they could pull to get to non-gaap profits.

any forecasting effort is a balance of many factors, any of which could be estimated incorrectly. i try to get the overall picture approximately right without getting too lost on the estimation of any specific detail. the solarcity split i keep is largely educated guesswork with a shaky foundation in reality.
I think solar has shrunk to a point that it only has minimal impact on revenue/profit.
 
Elon's words from the Q2 ER:

So, it’s a very important milestone, and I think we believe Tesla has – is now at the point of being self-funding, and we expect to be cash flow -- free cash flow positive in future quarters with the possible temporary exceptions around the launch and ramp of new product. From a profitability standpoint, we expect to be probably around breakeven this quarter and profitable next quarter, so that's -- I feel pretty confident about that.

So I'm expecting around breakeven.

I think a small non-GAAP loss is likely and would fit the statement ("around" breakeven).
 
i view steep drops in a prior quarter as not stopping at a flat line. it takes a while for the full effect of the drop to flow through a complete reporting period before you see the stable level.

i could easily be wrong this quarter if for example uk and australia orders were skewed towards the higher end, lifting overall asp.

What makes you think ASP is lower? Are you referring to all models or just S&X or just 3?

I recall seeing an analyst note out of Europe the other day where they said they had met with tesla who said ASP had stabilised around ~$50k (It always bother’s me about how this is legal)
 
  • Informative
Reactions: Fact Checking
i view steep drops in a prior quarter as not stopping at a flat line. it takes a while for the full effect of the drop to flow through a complete reporting period before you see the stable level.

i could easily be wrong this quarter if for example uk and australia orders were skewed towards the higher end, lifting overall asp.

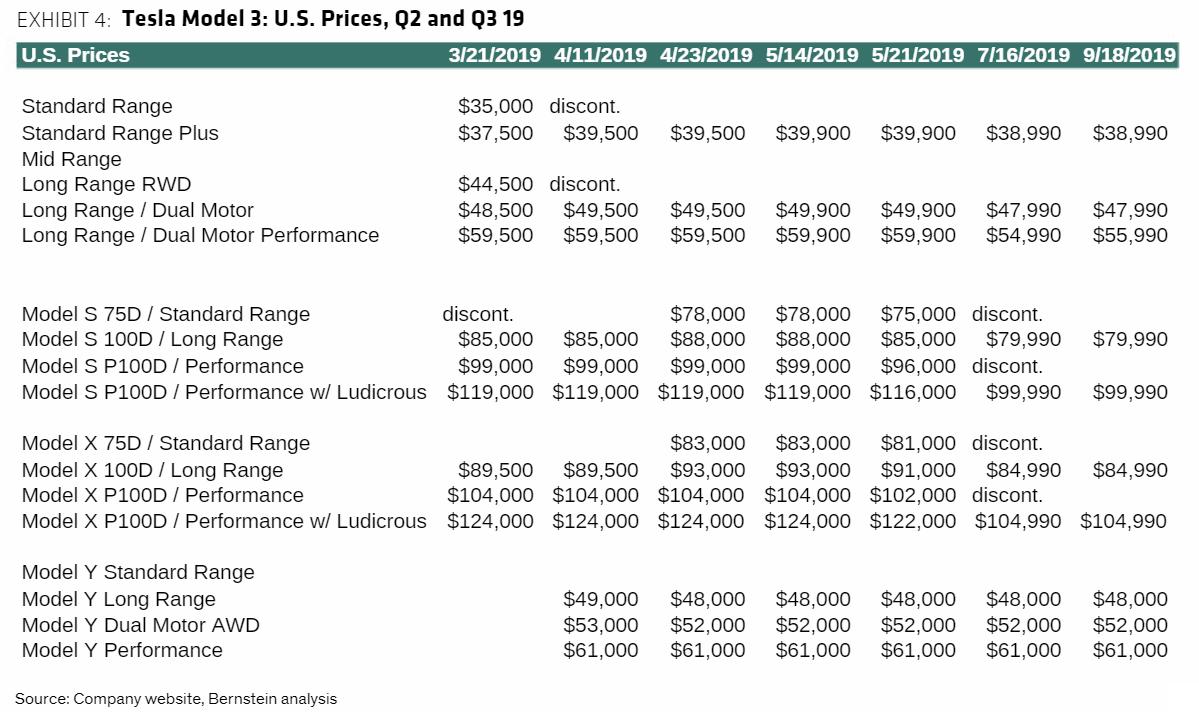
Bernstein has been snapshoting price trends in US. Apparently these are so called list prices without addons, without doc fee from the website.

EF81f-XX0AUVHWq.jpg:large