thanks for all the kind words. i can't believe how far away they were from where i guessed, and even more how far off the street was.
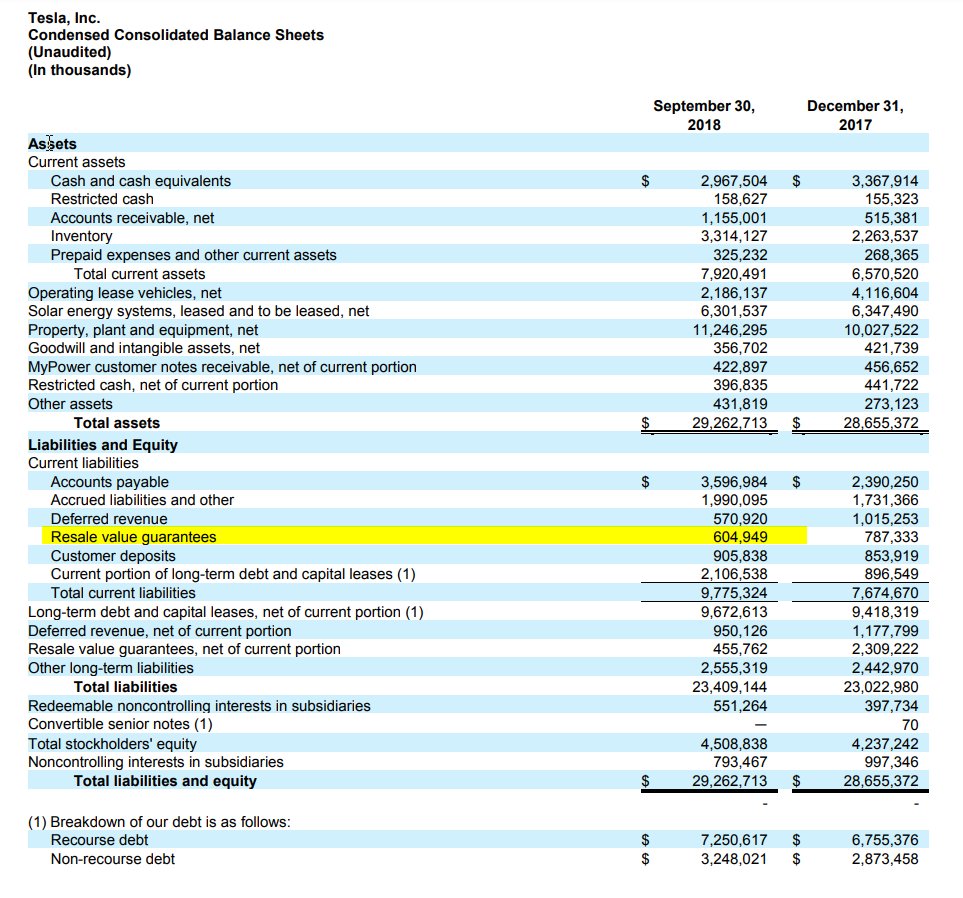
the most impressive thing is the cash generation. it's not happening on the back of payables expansion, it seems to be genuine cash margins on products sold. recall i had estimated nearly 30% cash gross margins on the model 3 and 1b cash flow from ops. they did 1.4b cash flow from ops, nearly 35% cash gross margins on the model 3, and this is with receivables growing by 600m.
this is a very rough update from the letter, when i get time i'll run through the 10q and try to update again.
many of the buckets in the balance sheet and cash flow statement are crudely done (inaccurate). i did line items wrong as i don't have details to break them into my usual buckets until the 10q. and here again is the whitespace i can't eliminate.
| … |
| s deliveries |
| x deliveries |
| s+x deliveries |
| 3 deliveries |
| 3 production |
| lease s/x % veh |
| avg price s+x |
| avg price model 3 |
|
| revenue |
| auto sales ex 3 |
| auto sales mod 3 |
| auto leasing |
| 1 time autopilot |
| zev credits |
| total auto |
|
| energy storage |
| solarcity |
| grohmann |
| services/other |
| total revenue |
|
| cost of revenue |
| auto sales ex 3 |
| auto sales mod 3 |
| auto leasing |
| total auto |
| energy storage |
| solarcity |
| grohmann |
| services & other |
| total cost of rev |
|
| gross profit |
|
| auto gaap ex 3 gm |
| auto-zev ex 3 gm |
| model 3 gm |
| auto-zev incl 3 gm |
| storage gm |
| scty gm |
| grohmann gm |
| services gm |
|
| opex |
| tesla r&d |
| tesla sg&a |
| 1 time costs |
| solarcity r&d |
| solarcity sg&a |
| total opex |
|
| op income |
|
| interest inc |
| interest exp |
| scty interest |
| other income exp |
| 1time scty gain |
| pretax income |
| income tax |
| net income |
| non-cont int. |
| net inc to common |
|
| basic shares |
| diluted shares |
|
| diluted gaap eps |
| gaap net income |
| + stock based comp |
| + one time scty |
| non-gaap net income |
| non-gaap diluted eps |
| dio |
| dpo |
|
|
| balance sheet |
| current assets |
| cash & eq. |
| restricted cash |
| accts rcvbl |
| inventory |
| prepaids+other |
| total current assets |
|
| op lease vehicles |
| solar energy sys |
| pp&e |
| intangible assets |
| goodwill |
| mypower rcvbls |
| restricted cash |
| other assets |
| total assets |
|
| current liabiliites |
| accts payable |
| accrued liabs+other |
| deferred revenue |
| resale value guar |
| cust deposits |
| curr debt+leases |
| curr solar bonds |
| total current liabs |
|
| lt debt+leases |
| solar bonds |
| rel party conv debt |
| deferred revenue |
| resale value guar |
| other lt liabilities |
| comm stk warrants |
| capital lease oblg |
| total liabilities |
|
| commits/contings |
| rdmbl ncis in subs |
| conv senior notes |
| nci in subsidiaries |
|
| common equity |
|
|
| cash flow statement |
| cash flows from ops |
| net loss |
| dep/amortization |
| stock-based comp |
| am of debt discount |
| inv write-down |
| loss on disposals |
| forex loss (gain) |
| loss on acq scty |
| non-cash int/other |
|
| chgs in op as/lb |
| accts rcbl |
| inv / op leases |
| prepaids/other ca |
| mypower rcvbls + other |
| accts pybl/accr liabs |
| deferred revenue |
| customer deposits |
| other lt liabs |
| net cash from ops |
|
| cash flows from inv |
| pp&e purchases |
| purchase solar sys |
| net cash from inv |
|
| cash flows from fin |
| stock issued |
| debt issued |
| debt repayments |
| rel pty solar repaids |
| coll lease borrowing |
| stock option excrs |
| capital lease paids |
| stock+debt issue cost |
| investment by nci in subs |
| dist to nci in subs |
| buyouts of nci in subs |
| net cash from fin |
| forex effect |
| net change in cash |
| cash & eq start |
| cash & eq end |
[TD2]
luv q4-18e
[/TD2][TD2]
Sep-18
[/TD2][TD2]
Jun-18
[/TD2][TD2]
Mar-18
[/TD2]
[TD2]15,000[/TD2][TD2]14,495[/TD2][TD2]10,939[/TD2][TD2]11,738[/TD2]
[TD2]13,000[/TD2][TD2]13,215[/TD2][TD2]11,380[/TD2][TD2]10,077[/TD2]
[TD2]
28,000
[/TD2][TD2]
27,710
[/TD2][TD2]
22,319
[/TD2][TD2]
21,815
[/TD2]
[TD2]
60,000
[/TD2][TD2]
56,065
[/TD2][TD2]
18,449
[/TD2][TD2]
8,182
[/TD2]
[TD2]
60,000
[/TD2][TD2]
53,239
[/TD2][TD2]
28,578
[/TD2][TD2]
9,766
[/TD2]
[TD2]
0.11
[/TD2][TD2]
0.09
[/TD2][TD2]
0.11
[/TD2][TD2]
0.11
[/TD2]
[TD2]
103.00
[/TD2][TD2]
104.80
[/TD2][TD2]
105.14
[/TD2][TD2]
105.42
[/TD2]
[TD2]
58.00
[/TD2][TD2]
56.78
[/TD2][TD2]
55.80
[/TD2][TD2]
56.80
[/TD2]
[TD2]2,566,760[/TD2][TD2]2,642,647[/TD2][TD2]2,088,411[/TD2][TD2]2,046,829[/TD2]
[TD2]3,480,000[/TD2][TD2]3,183,389[/TD2][TD2]1,029,454[/TD2][TD2]464,738[/TD2]
[TD2]210,044[/TD2][TD2]220,461[/TD2][TD2]239,816[/TD2][TD2]173,436[/TD2]
[TD2]0[/TD2][TD2]0[/TD2][TD2]0[/TD2][TD2]0[/TD2]
[TD2]100,000[/TD2][TD2]52,269[/TD2][TD2]0[/TD2][TD2]50,314[/TD2]
[TD2]
6,356,804
[/TD2][TD2]
6,098,766
[/TD2][TD2]
3,357,681
[/TD2][TD2]
2,735,317
[/TD2]
[TD2]171,500[/TD2][TD2]116,597[/TD2][TD2]111,651[/TD2][TD2]185,022[/TD2]
[TD2]205,200[/TD2][TD2]282,720[/TD2][TD2]262,757[/TD2][TD2]225,000[/TD2]
[TD2]0[/TD2][TD2]0[/TD2][TD2]0[/TD2][TD2]0[/TD2]
[TD2]300,000[/TD2][TD2]326,330[/TD2][TD2]270,142[/TD2][TD2]263,412[/TD2]
[TD2]
7,033,504
[/TD2][TD2]
6,824,413
[/TD2][TD2]
4,002,231
[/TD2][TD2]
3,408,751
[/TD2]
[TD2]1,813,536[/TD2][TD2]1,875,125[/TD2][TD2]1,546,610[/TD2][TD2]1,517,446[/TD2]
[TD2]2,714,400[/TD2][TD2]2,530,794[/TD2][TD2]983,129[/TD2][TD2]573,951[/TD2]
[TD2]130,227[/TD2][TD2]119,283[/TD2][TD2]136,915[/TD2][TD2]104,496[/TD2]
[TD2]
4,658,163
[/TD2][TD2]
4,525,202
[/TD2][TD2]
2,666,654
[/TD2][TD2]
2,195,893
[/TD2]
[TD2]171,500[/TD2][TD2]132,650[/TD2][TD2]146,343[/TD2][TD2]217,863[/TD2]
[TD2]143,640[/TD2][TD2]197,904[/TD2][TD2]183,930[/TD2][TD2]157,500[/TD2]
[TD2]11,000[/TD2][TD2]11,000[/TD2][TD2]11,000[/TD2][TD2]11,000[/TD2]
[TD2]375,000[/TD2][TD2]433,992[/TD2][TD2]375,374[/TD2][TD2]369,969[/TD2]
[TD2]
5,359,303
[/TD2][TD2]
5,300,748
[/TD2][TD2]
3,383,301
[/TD2][TD2]
2,952,225
[/TD2]
[TD2]
1,674,201
[/TD2][TD2]
1,523,665
[/TD2][TD2]
618,930
[/TD2][TD2]
456,526
[/TD2]
[TD2]32.4%[/TD2][TD2]31.6%[/TD2][TD2]27.7%[/TD2][TD2]28.6%[/TD2]
[TD2]30.0%[/TD2][TD2]30.3%[/TD2][TD2]27.7%[/TD2][TD2]26.9%[/TD2]
[TD2]22.0%[/TD2][TD2]20.5%[/TD2][TD2]4.5%[/TD2][TD2]-23.5%[/TD2]
[TD2]25.6%[/TD2][TD2]25.2%[/TD2][TD2]20.6%[/TD2][TD2]18.2%[/TD2]
[TD2]0.0%[/TD2][TD2]-13.8%[/TD2][TD2]-31.1%[/TD2][TD2]-17.7%[/TD2]
[TD2]30.0%[/TD2][TD2]30.0%[/TD2][TD2]30.0%[/TD2][TD2]30.0%[/TD2]
[TD2]-100.0%[/TD2][TD2]-100.0%[/TD2][TD2]-100.0%[/TD2][TD2]-100.0%[/TD2]
[TD2]-25.0%[/TD2][TD2]-33.0%[/TD2][TD2]-39.0%[/TD2][TD2]-40.5%[/TD2]
[TD2]360,000[/TD2][TD2]315,848[/TD2][TD2]341,129[/TD2][TD2]322,096[/TD2]
[TD2]630,000[/TD2][TD2]599,876[/TD2][TD2]610,759[/TD2][TD2]551,404[/TD2]
[TD2]20,000[/TD2][TD2]26,184[/TD2][TD2]103,434[/TD2][TD2]0[/TD2]
[TD2]50,000[/TD2][TD2]35,000[/TD2][TD2]45,000[/TD2][TD2]45,000[/TD2]
[TD2]145,000[/TD2][TD2]130,000[/TD2][TD2]140,000[/TD2][TD2]135,000[/TD2]
[TD2]
1,205,000
[/TD2][TD2]
1,106,908
[/TD2][TD2]
1,240,322
[/TD2][TD2]
1,053,500
[/TD2]
[TD2]
469,201
[/TD2][TD2]
416,757
[/TD2][TD2]
-621,392
[/TD2][TD2]
-596,974
[/TD2]
[TD2]6,000[/TD2][TD2]6,907[/TD2][TD2]5,064[/TD2][TD2]5,214[/TD2]
[TD2]-107,000[/TD2][TD2]-122,220[/TD2][TD2]-110,582[/TD2][TD2]-102,546[/TD2]
[TD2]-53,000[/TD2][TD2]-53,000[/TD2][TD2]-53,000[/TD2][TD2]-47,000[/TD2]
[TD2]-12,000[/TD2][TD2]22,876[/TD2][TD2]50,911[/TD2][TD2]-37,716[/TD2]
[TD2]0[/TD2][TD2]0[/TD2][TD2]0[/TD2][TD2]0[/TD2]
[TD2]
303,201
[/TD2][TD2]
271,320
[/TD2][TD2]
-728,999
[/TD2][TD2]
-779,022
[/TD2]
[TD2]19,999[/TD2][TD2]16,647[/TD2][TD2]13,707[/TD2][TD2]5,605[/TD2]
[TD2]
283,202
[/TD2][TD2]
254,673
[/TD2][TD2]
-742,706
[/TD2][TD2]
-784,627
[/TD2]
[TD2]-50,001[/TD2][TD2]-56,843[/TD2][TD2]-25,167[/TD2][TD2]-75,076[/TD2]
[TD2]
333,203
[/TD2][TD2]
311,516
[/TD2][TD2]
-717,539
[/TD2][TD2]
-709,551
[/TD2]
[TD2]172,000[/TD2][TD2]170,893[/TD2][TD2]169,997[/TD2][TD2]169,146[/TD2]
[TD2]183,000[/TD2][TD2]178,196[/TD2][TD2]169,997[/TD2][TD2]169,146[/TD2]
[TD2]
1.82
[/TD2][TD2]
1.75
[/TD2][TD2]
-4.22
[/TD2][TD2]
-4.19
[/TD2]
[TD2]333,203[/TD2][TD2]311,516[/TD2][TD2]-717,539[/TD2][TD2]-709,551[/TD2]
[TD2]208,000[/TD2][TD2]204,728[/TD2][TD2]197,344[/TD2][TD2]141,639[/TD2]
[TD2]0[/TD2][TD2]0[/TD2][TD2]0[/TD2][TD2]0[/TD2]
[TD2]541,203[/TD2][TD2]516,244[/TD2][TD2]-520,195[/TD2][TD2]-567,912[/TD2]
[TD2]
2.96
[/TD2][TD2]
2.90
[/TD2][TD2]
-3.06
[/TD2][TD2]
-3.36
[/TD2]
[TD2]
72.00
[/TD2][TD2]
57.05
[/TD2][TD2]
89.67
[/TD2][TD2]
79.31
[/TD2]
[TD2]
77.00
[/TD2][TD2]
61.92
[/TD2][TD2]
81.73
[/TD2][TD2]
80.47
[/TD2]
[TD2]3,390,137[/TD2][TD2]2,967,504[/TD2][TD2]2,236,424[/TD2][TD2]2,665,673[/TD2]
[TD2]150,000[/TD2][TD2]158,627[/TD2][TD2]146,822[/TD2][TD2]120,194[/TD2]
[TD2]1,156,192[/TD2][TD2]1,155,001[/TD2][TD2]569,874[/TD2][TD2]652,848[/TD2]
[TD2]4,228,710[/TD2][TD2]3,314,127[/TD2][TD2]3,324,643[/TD2][TD2]2,565,826[/TD2]
[TD2]381,125[/TD2][TD2]325,232[/TD2][TD2]422,034[/TD2][TD2]379,379[/TD2]
[TD2]
9,306,165
[/TD2][TD2]
7,920,491
[/TD2][TD2]
6,699,797
[/TD2][TD2]
6,383,920
[/TD2]
[TD2]2,348,826[/TD2][TD2]2,186,137[/TD2][TD2]2,282,047[/TD2][TD2]2,315,124[/TD2]
[TD2]6,298,522[/TD2][TD2]6,301,537[/TD2][TD2]6,340,031[/TD2][TD2]6,346,374[/TD2]
[TD2]11,777,601[/TD2][TD2]11,246,295[/TD2][TD2]10,969,348[/TD2][TD2]10,519,226[/TD2]
[TD2]320,000[/TD2][TD2]296,465[/TD2][TD2]300,406[/TD2][TD2]346,428[/TD2]
[TD2]60,237[/TD2][TD2]60,237[/TD2][TD2]64,284[/TD2][TD2]61,284[/TD2]
[TD2]415,897[/TD2][TD2]422,897[/TD2][TD2]434,841[/TD2][TD2]449,754[/TD2]
[TD2]400,000[/TD2][TD2]396,835[/TD2][TD2]399,992[/TD2][TD2]433,841[/TD2]
[TD2]273,123[/TD2][TD2]431,819[/TD2][TD2]419,254[/TD2][TD2]415,478[/TD2]
[TD2]
31,200,370
[/TD2][TD2]
29,262,713
[/TD2][TD2]
27,910,000
[/TD2][TD2]
27,271,429
[/TD2]
[TD2]4,522,371[/TD2][TD2]3,596,984[/TD2][TD2]3,030,493[/TD2][TD2]2,603,498[/TD2]
[TD2]2,226,703[/TD2][TD2]1,990,095[/TD2][TD2]1,814,979[/TD2][TD2]1,898,431[/TD2]
[TD2]563,718[/TD2][TD2]570,920[/TD2][TD2]576,321[/TD2][TD2]536,465[/TD2]
[TD2]600,000[/TD2][TD2]604,949[/TD2][TD2]674,255[/TD2][TD2]629,112[/TD2]
[TD2]965,000[/TD2][TD2]905,838[/TD2][TD2]942,129[/TD2][TD2]984,823[/TD2]
[TD2]1,500,000[/TD2][TD2]2,106,538[/TD2][TD2]2,020,685[/TD2][TD2]1,915,530[/TD2]
[TD2]0[/TD2][TD2]0[/TD2][TD2]82,500[/TD2][TD2]82,500[/TD2]
[TD2]
10,377,792
[/TD2][TD2]
9,775,324
[/TD2][TD2]
9,141,362
[/TD2][TD2]
8,650,359
[/TD2]
[TD2]9,600,000[/TD2][TD2]9,672,613[/TD2][TD2]9,510,696[/TD2][TD2]8,761,070[/TD2]
[TD2]100[/TD2][TD2]100[/TD2][TD2]100[/TD2][TD2]100[/TD2]
[TD2]2,519[/TD2][TD2]2,519[/TD2][TD2]2,594[/TD2][TD2]2,556[/TD2]
[TD2]822,089[/TD2][TD2]950,126[/TD2][TD2]795,820[/TD2][TD2]818,250[/TD2]
[TD2]650,000[/TD2][TD2]455,762[/TD2][TD2]584,857[/TD2][TD2]756,800[/TD2]
[TD2]3,313,750[/TD2][TD2]2,552,700[/TD2][TD2]2,607,458[/TD2][TD2]2,561,886[/TD2]
[TD2]0[/TD2][TD2]0[/TD2][TD2]0[/TD2][TD2]0[/TD2]
[TD2]0[/TD2][TD2]0[/TD2][TD2]0[/TD2][TD2]0[/TD2]
[TD2]
24,766,250
[/TD2][TD2]
23,409,144
[/TD2][TD2]
22,642,887
[/TD2][TD2]
21,551,021
[/TD2]
[TD2]540,000[/TD2][TD2]551,264[/TD2][TD2]539,536[/TD2][TD2]405,835[/TD2]
[TD2]0[/TD2][TD2]0[/TD2][TD2]0[/TD2][TD2]2[/TD2]
[TD2]900,000[/TD2][TD2]793,467[/TD2][TD2]821,156[/TD2][TD2]863,876[/TD2]
[TD2]
4,994,120
[/TD2][TD2]
4,508,838
[/TD2][TD2]
3,906,421
[/TD2][TD2]
4,450,695
[/TD2]
[TD2]283,202[/TD2][TD2]254,673[/TD2][TD2]-742,706[/TD2][TD2]-784,627[/TD2]
[TD2]494,659[/TD2][TD2]502,825[/TD2][TD2]485,255[/TD2][TD2]416,233[/TD2]
[TD2]208,000[/TD2][TD2]204,728[/TD2][TD2]197,344[/TD2][TD2]141,639[/TD2]
[TD2]35,000[/TD2][TD2]0[/TD2][TD2]35,074[/TD2][TD2]39,345[/TD2]
[TD2]33,141[/TD2][TD2]0[/TD2][TD2]27,552[/TD2][TD2]18,546[/TD2]
[TD2]45,000[/TD2][TD2]77,737[/TD2][TD2]66,613[/TD2][TD2]52,237[/TD2]
[TD2]25,000[/TD2][TD2]0[/TD2][TD2]-41,476[/TD2][TD2]47,661[/TD2]
[TD2]0[/TD2][TD2]0[/TD2][TD2]0[/TD2][TD2]0[/TD2]
[TD2]0[/TD2][TD2]0[/TD2][TD2]9,669[/TD2][TD2]-3,984[/TD2]
[TD2]-1,191[/TD2][TD2]-585,127[/TD2][TD2]70,633[/TD2][TD2]-169,142[/TD2]
[TD2]-1,077,272[/TD2][TD2]106,426[/TD2][TD2]-822,487[/TD2][TD2]-419,277[/TD2]
[TD2]0[/TD2][TD2]0[/TD2][TD2]-45,193[/TD2][TD2]-50,001[/TD2]
[TD2]-15,000[/TD2][TD2]-15,000[/TD2][TD2]-1,863[/TD2][TD2]-57,583[/TD2]
[TD2]1,111,995[/TD2][TD2]691,607[/TD2][TD2]591,737[/TD2][TD2]317,983[/TD2]
[TD2]75,000[/TD2][TD2]65,000[/TD2][TD2]61,702[/TD2][TD2]45,795[/TD2]
[TD2]59,162[/TD2][TD2]-36,291[/TD2][TD2]-24,439[/TD2][TD2]67,359[/TD2]
[TD2]0[/TD2][TD2]0[/TD2][TD2]42,484[/TD2][TD2]-60,560[/TD2]
[TD2]
1,276,696
[/TD2][TD2]
1,391,281
[/TD2][TD2]
-129,664
[/TD2][TD2]
-398,376
[/TD2]
[TD2]-700,000[/TD2][TD2]-510,271[/TD2][TD2]-609,813[/TD2][TD2]-655,662[/TD2]
[TD2]-60,000[/TD2][TD2]-49,494[/TD2][TD2]-67,400[/TD2][TD2]-72,975[/TD2]
[TD2]
-760,000
[/TD2][TD2]
-560,965
[/TD2][TD2]
-682,817
[/TD2][TD2]
-728,637
[/TD2]
[TD2]0[/TD2][TD2]0[/TD2][TD2]0[/TD2][TD2]0[/TD2]
[TD2]100,000[/TD2][TD2]114,942[/TD2][TD2]1,267,746[/TD2][TD2]1,775,481[/TD2]
[TD2]-400,000[/TD2][TD2]-195,760[/TD2][TD2]-879,328[/TD2][TD2]-1,389,388[/TD2]
[TD2]0[/TD2][TD2]0[/TD2][TD2]0[/TD2][TD2]-17,500[/TD2]
[TD2]100,000[/TD2][TD2]-142,568[/TD2][TD2]-113,426[/TD2][TD2]-87,092[/TD2]
[TD2]75,000[/TD2][TD2]0[/TD2][TD2]31,053[/TD2][TD2]94,018[/TD2]
[TD2]-30,000[/TD2][TD2]0[/TD2][TD2]-29,395[/TD2][TD2]-18,787[/TD2]
[TD2]-12,000[/TD2][TD2]0[/TD2][TD2]-758[/TD2][TD2]-2,913[/TD2]
[TD2]75,000[/TD2][TD2]44,294[/TD2][TD2]179,333[/TD2][TD2]73,704[/TD2]
[TD2]-50,000[/TD2][TD2]94,874[/TD2][TD2]-56,603[/TD2][TD2]-52,942[/TD2]
[TD2]0[/TD2][TD2]0[/TD2][TD2]0[/TD2][TD2]-2,921[/TD2]
[TD2]
-142,000
[/TD2][TD2]
-84,218
[/TD2][TD2]
398,622
[/TD2][TD2]
371,660
[/TD2]
[TD2]47,937[/TD2][TD2]-6,370[/TD2][TD2]-22,611[/TD2][TD2]10,102[/TD2]
[TD2]
422,633
[/TD2][TD2]
739,728
[/TD2][TD2]
-436,470
[/TD2][TD2]
-745,251
[/TD2]
[TD2]
2,967,504
[/TD2][TD2]
2,236,424
[/TD2][TD2]
2,665,673
[/TD2][TD2]
3,367,914
[/TD2]
[TD2]
3,390,137
[/TD2][TD2]
2,967,504
[/TD2][TD2]
2,236,424
[/TD2][TD2]
2,665,673
[/TD2]