Welcome to Tesla Motors Club
Discuss Tesla's Model S, Model 3, Model X, Model Y, Cybertruck, Roadster and More.
Register

Range Loss Over Time, What Can Be Expected, Efficiency, How to Maintain Battery Health

This site may earn commission on affiliate links.
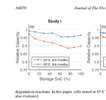
Interesting data in those charts. Any reason why the first set of charts shows calendar aging at 100% is equal to or better than 50%?

The shape of curve is much different between these two types of 2170 datasets. The first set shows a larger degradation from 60-90% while the other set shows worse degradation for 60% and up. Why the differing phenomena?
 
  • Like
Reactions: KenC
Below is a calendar aging chart for a 2170 NCA battery of ”a brand thst can not be desclosed”.
I have a bunch of Panasonic 2170 NCA of two lots and my preliminary data points to that this chart is for the Tesla 2170 cell or a very closely related cell.

View attachment 877071

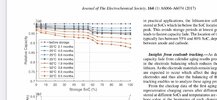
I would be cautious about this report - if I am correct, here is a link to the report:

An excerpt from the paper:
Cells kept at 100 % SoC do not show the fastest capacity fade but develop internal short circuits for temperatures T ≥ 40 oC. Degradation is slowest for cells stored close to 0 % SoC at all temperatures
The short circuits cause excessive self-discharge and open circuit voltage drift. I have to read the paper a bit closer, but it appears that since they did not keep the cells topped off, the short circuits may be discharging the 90-100% cells enough to drop the cell voltages down to lower levels. They also talk about how that self-discharge process may mitigate the buildup of SEI layer which is the primary cause of capacity loss.

They also mention that the internal resistance of the cells increases faster when stored at higher SOC, but I didn't see a chart describing that.
 
Interesting data in those charts. Any reason why the first set of charts shows calendar aging at 100% is equal to or better than 50%?
Why lower at 100%, read further down.
The shape of curve is much different between these two types of 2170 datasets.
The upper one is 2170 (21700), the second 18650. This is only the format of the cell though. 21x70mm and 18x65mm.
The format do not make a noticeble difference in calendar aging.

18650 NCA tests can be with older texhnology and chemistry but a panasonic 2170 NCA is most probably from a quite new cell.

The first set shows a larger degradation from 60-90% while the other set shows worse degradation for 60% and up. Why the differing phenomena?
The basics is that the lower the SOC, the lower the calendar aging.
Exact behaviour depends on the chemistry and one part making a noticeble difference is the central graphite peak, which cause the calendar aging to increase rapidly above about 57-58% (true) SOC (= above 55% displayed SOC on a Tesla). You can read about central graphite peak influenge on Panasonic NCA here.

For very many studies we can se or just hunch that the calendar aging is less above 90% than it is at 75-90% for normal temperatures:
EEBC5379-113C-44BF-BC1A-881BE1E00894.jpeg
1051B743-EF17-4EB2-BAA6-CEF104B3D92B.jpeg
1D7E85D1-67E1-4597-A4F5-D440D60965A3.jpeg

These are 18650 NCA, research reports from 3 to 5 year back. We can se it, or se the slight hint of it like for the first four months in the second picture from above.
It is very clear in the third pic from above.


Below the only research report of 2170 NCA i have read. It is clear that calendar aging is less above 80%. If I recall it correct they did think that the self discharge, that is higher at the highest SOC numbers, cause a flow of lithium ions (or something like that) that counteract the lithium plating or SEI build up.
Except for the above 80% behaviour it more or less identical with the other research reports. Take notice of that the number of test points and position can make the chart look different. If you search the net you will find a lot of research that did check calendar aging on screen only two, three, four or five points with straight lines drawn between, effectively masking the true degradation between the data points.
D0CE0DA9-7F56-4241-BB3C-97ADA9B23E93.jpeg

My own tests of 2170 NCA is quite early, 6-8 months, in the process but from what Ive seen so far, 100% cause less calendar aging than 80% at 15-20C. My cells (35 pieces) follows the graphs quite nice.

I wouldnt use the charts as a proof to use 100% instead of 50%, but the myth that 100% is very bad is killed.
Also, 90% might be about as good as 80% or even better.

Also, remember that these charts show degradation from [time].
Reducing the time by charging late from a low SOC and driving the car to low SOC without having it standing will reduce the most part of the calendar aging.
 
I agree to be cautious about using the data to motivate charging to 100% and leave it there, but not to br cautious about the report itself.
Yes, it is that report.

We will not start daily charge to 100% because of this report, that is absolutely clear :)
An excerpt from the paper:

The short circuits cause excessive self-discharge and open circuit voltage drift. I have to read the paper a bit closer, but it appears that since they did not keep the cells topped off, the short circuits may be discharging the 90-100% cells enough to drop the cell voltages down to lower levels. They also talk about how that self-discharge process may mitigate the buildup of SEI layer which is the primary cause of capacity loss.
See my former post, we was probably writing at the same time.
They also mention that the internal resistance of the cells increases faster when stored at higher SOC, but I didn't see a chart describing that.
Yes, it is well known that both NCA and NMC will increase the IR with high SOC during time. This is one of the reasons that i keep my SOC low during time (to keep the performance of my M3P).

Most people do not understand what the IR means and even less how it effect the car.
I have tried to reduce the writing on things people wouldnt anyway understand but still there was some posts made about IR:
with IR chart
Deeper digging with more charts
(Most research reports include the change in IR for calendar and/or cyclic caging.)

In most cases there is a clear relation between loss of capacity (cyclic or calendar) and the increased Internal Resistance. This is easy to see:
85C47BEA-6242-4060-858C-ACBC4CF62DFB.jpeg
 
The last part is my point. The battery pack will adopt ambient temp anyway with more insulation. Even with 2 inch around it wich would make it about 4” thicker (not a nice design in a EV) it would reach ambient temp .
Also Tesla do not cool the pack down to ambient when driving. During hot days it get some 40C (~100F) from highway driving. This means that it either would cool much slower (which increase average temp) or that the car would need to use energy to cool it.

The insulation part is more or less impossible due to the space. Would increase the height of the car. A model 3 would look like Y and Y would be Y^2.

Even 1cm would be significant compared to just the enclosure if you are actively cooling the pack. The R value would be increased by an order of magnitude. All I am saying is that I should be able to keep the battery cool using the existing means and ideally there should be a little more insulation.

When driving in warm climate the battery gets hot. The same for charging.
And parking in the sun will set the pack at ambient plus 5C (10F) above.

The battery gets actively cooled/heated while driving. I'm less concerned with that and more concerned when the car is parked. I know the car will use the AC to cool the battery pack while parked, but I have no way of lowering the threshold. If my car has cabin overheat protection which I can set to lower value, there is no reason why I would not be able to set the battery cooling to lower threshold too. I always have cabin overheat protection enabled and it uses surprisingly little power.

100% is not as bad as most people think. That is a forum myth living its good days.
This can be seen in the charts above. Most
of these research reports of NCA cells show a slight reduction at 100% SOC compared to 80-90% for 25C and colder.
The uppermost chart which I think could be the Tesla 2170 (first version cell, not 2170L) had a much bigger Reduction of calendar aging at 100% SOC then the rest of the research shows, but the rest of the research is on 18650 cells.

My ‘21 M3P has quite low degradation, soon 2 years and now at 54K Km.
I have about 20% Supercharging and have made quite many 100%
Charges (About 1/month in average so 25 or so).

I was not talking about changing to 100%. I'm saying that when I bough my car it was not at 100% capacity. If the EPA rating was 315 miles, mine was something like 306, so already under the expected original capacity.
 
  • Like
Reactions: AAKEE
Even 1cm would be significant compared to just the enclosure if you are actively cooling the pack. The R value would be increased by an order of magnitude. All I am saying is that I should be able to keep the battery cool using the existing means and ideally there should be a little more insulation.
When driving yes. But Im quite sure Tesla wont follow that idea to keep the AC on to cool the battery ;)
The battery gets actively cooled/heated while driving. I'm less concerned with that and more concerned when the car is parked. I know the car will use the AC to cool the battery pack while parked, but I have no way of lowering the threshold. If my car has cabin overheat protection which I can set to lower value, there is no reason why I would not be able to set the battery cooling to lower threshold too. I always have cabin overheat protection enabled and it uses surprisingly little power.
I havent seen the AC cool the pack, other then just briefly after a drive. For a days parking in the sun inte the summer, im quite sure tesla doesnt cool it over time.
Cabin overheat protection isnt needed at my place so I havent tested, but what it need to do is to cool the cabin dont do ambient, or about. This is becuse of the green house effect, so the isnt any big need for the AC to work (at least unless the ambient is above the cabin heat protection threshold).
The battery get to about 5C above ambient in the sun, so if it is very warm and you would like to cool the battery below ambient (= cool more then 5C) you would need to use the AC. It would use a lot of energy and if not connected it will increase the cycles and cycle depth on the battery.
I was not talking about changing to 100%. I'm saying that when I bough my car it was not at 100% capacity. If the EPA rating was 315 miles, mine was something like 306, so already under the expected original capacity.
👍
But not really fun to "get it" at 306 miles. I have about 305-306 miles today, after 2 years and 53K km (33K mi). 78.1kWh nominal full pack.
Did you never see a higher vaule than 306?

LBL.png
 
But not really fun to "get it" at 306 miles. I have about 305-306 miles today, after 2 years and 53K km (33K mi). 78.1kWh nominal full pack.
Did you never see a higher vaule than 306?

View attachment 877318

Mine is performance 2022 model which when new the EPA estimated range is 315. I think the most I saw was 310, now looking at some pictures it was 308 after a 2 months and 3k miles. Now it is exactly 1 year old and 18k miles and seems to be around 294 or so. I was thinking about putting the car in service mode and running a battery test. Any idea if Tesla has an issue with that? it says you need to be a service technician, but anyone can run it.
 
  • Funny
Reactions: KenC
I agree to be cautious about using the data to motivate charging to 100% and leave it there, but not to br cautious about the report itself.
Yes - that was my intent - just to be sure not to take the reduced capacity loss when stored at 100% SOC as a green light to go ahead and do that since there are other effects at play.

I also have to wonder how realistic these static tests are compared to a more typical situation of where usage is mixed across a number of behaviors includting storage, cycling, etc.

Either way, it's clear that for storage, best results are had as close to 0% as possible, but even 60% and lower is a good spot to charge to if that gives you enough range - rate of degradation (whether capacity or internal micro-shorts) is good even if you have to store it a while and if you time your charges to finish right before you drive, you'll likely spend a decent amount of time below 40% SOC where rate of degradation loss drops even more.
 
Yes - that was my intent - just to be sure not to take the reduced capacity loss when stored at 100% SOC as a green light to go ahead and do that since there are other effects at play.
Absolutely!
👍


100% is not a good point to store batteries in.
I started reading about lithium batteries (LiPo) when I got into RC-helicopters about 2006. I did learn a bit, besides finding that the rumors in forums was wrong sometimes, I also lesrned how to handle the batteries.
Some friends consistently left the batteries at 100% (4.20V/cell) and they needed new batteries each year. Even a half year at 100% made the batteries loose much power due to increased internal resistance.

I have som batteries bought 2010 that still works fine. There is a noticable difference in power but they actually still work fine.
I also have to wonder how realistic these static tests are compared to a more typical situation of where usage is mixed across a number of behaviors includting storage, cycling, etc.
Probably quite close.
Some research involve plotting the battery life and degradation curve from tests with calendar aging( 1-2years test, and assuming that it follows about square root of time) plus cycle tests with different DoD/SOC regions.
It seems that the sum of these presented in graphs is not very far away from the “real”values we see.

I did an calculation to prognose my car at the time I bought it. I did update it slightly when I did get actual logged data on average SOC and average battery temp.
I should have around 78 kWh right now, and the NFP is at 78.1 kWh.
Either way, it's clear that for storage, best results are had as close to 0% as possible, but even 60% and lower is a good spot to charge to if that gives you enough range - rate of degradation (whether capacity or internal micro-shorts) is good even if you have to store it a while and if you time your charges to finish right before you drive, you'll likely spend a decent amount of time below 40% SOC where rate of degradation loss drops even more.
I’d like to add that staying slightly below the central graphite peak instead of slightly above might make a big difference (in the ball park of 50% less) in degradation the first year, despite only backing of perhaps 5% SOC. A very small offer for a big win. (Staying below 58% true Soc). Only possible if the range is sufficient below the peak of course.
The central graphite peak moves upwards with time, at least if the SOC is above 60%.
So 60% take the larger hit year one and maybe get on the good side after one year.
 
Mine is performance 2022 model which when new the EPA estimated range is 315. I think the most I saw was 310, now looking at some pictures it was 308 after a 2 months and 3k miles. Now it is exactly 1 year old and 18k miles and seems to be around 294 or so. I was thinking about putting the car in service mode and running a battery test. Any idea if Tesla has an issue with that? it says you need to be a service technician, but anyone can run it.
Sure, you can run the battery test, but watch a couple youtube vids, because be prepared as it may take some time. On the other hand, your 6% drop is within the normal range, though, a little on the low side. The forum members from Texas do seem to show a little faster drop than colder latitudes, but that's obviously anecdotal.
 
  • Like
Reactions: DrGriz
Sure, you can run the battery test, but watch a couple youtube vids, because be prepared as it may take some time. On the other hand, your 6% drop is within the normal range, though, a little on the low side. The forum members from Texas do seem to show a little faster drop than colder latitudes, but that's obviously anecdotal.

I saw a youtube video and it seems like most of the time is spent discharging the battery is there is a lot of change, so if you start with an almost empty battery and you have 11.5KW charger, then it should be able to finish in one night. My only concern is that it the car says the test should be performed only by "service personnel". I don't know why they would say that. I would not want to void any warranty.

As far as my degradation now it is maybe more like 7%. Right now my car shows 164 miles at 56% so that is exactly 7% degradation, but obviously this is not that exact and that is why I wanted to run the test.
 
As far as my degradation now it is maybe more like 7%. Right now my car shows 164 miles at 56% so that is exactly 7% degradation, but obviously this is not that exact and that is why I wanted to run the test.

Theres about 2% degradation hidden in the range. From the marked capacity (82.1 kWh) the capacity can reduce to 80.6 kWh before the range start to reduce.
This is of course if you count the cspacity from the marked size. Tesla set the number lower, I gues to get a little headroom for degradstion before the car is delivered.
 
I saw a youtube video and it seems like most of the time is spent discharging the battery is there is a lot of change, so if you start with an almost empty battery and you have 11.5KW charger, then it should be able to finish in one night. My only concern is that it the car says the test should be performed only by "service personnel". I don't know why they would say that. I would not want to void any warranty.

As far as my degradation now it is maybe more like 7%. Right now my car shows 164 miles at 56% so that is exactly 7% degradation, but obviously this is not that exact and that is why I wanted to run the test.
Do you have a recent version of the software that shows you the new Energy Screen? If so, if you do a trip, it'll give you the Arrived With figure to the tenths of a mile, and the SOC to the tenth of a percent. Here's mine from yesterday:

IMG_6408.jpeg
IMG_6408 (1).jpeg

151.1 miles remaining with 48.7% SOC. The math will give you a far more precise answer than before. In my case, 310 miles.
 
Do you have a recent version of the software that shows you the new Energy Screen? If so, if you do a trip, it'll give you the Arrived With figure to the tenths of a mile, and the SOC to the tenth of a percent. Here's mine from yesterday:

View attachment 877706View attachment 877707
151.1 miles remaining with 48.7% SOC. The math will give you a far more precise answer than before. In my case, 310 miles.

Yes I have the new app. Thanks for the tip. It looks like my degradation is even worse.
153.2 miles at 53.2% so that's 8.6% in first year and 18k but again I don't believe it was ever 0% even when it was new. I wish I could get that data.
 
  • Informative
Reactions: KenC
Just an update on my Tesla Model 3 Performance (march 2021 with exactly 40.000 km). The rollercoaster continues: 77,0 kWh NFP and 486-487 km Range. Basically always Supercharged since April 2022 Up to 58%-max 60%. More (up to 90% 95% if during trips) , but at the first rest always under 55%.
1669543921797.png
 
  • Informative
  • Like
Reactions: KenC and AAKEE
Just an update on my Tesla Model 3 Performance (march 2021 with exactly 40.000 km). The rollercoaster continues: 77,0 kWh NFP and 486-487 km Range.

I hope you can relax despite the ’bumpy ride’. You know that the bumps is BMS estimation induced and not real changes in range/capacity.

I had one ’bump’, I guess I caused it myself.
The intent was to do an opposite BMS calibration to take the range down from full range (not really probable) and hoping it would settle at the real range. My own calculation said 78.5-79kWh( ~ 495km range), like this line.
Wen the range dropped, it dropped to about 480-485km and 75.7-77kWh which was clearly lower than my estimate.

During this time I could see that after a long drive, for example parking with 32%, the car would increase the SOC-number to 33% even before sleeping and after it slept it would be 34%. This indicates that the BMS is off, the capacity is estimated too small which cause a SOC calculation during driving to calculate to much SOC used.
I ”knew” this, also made a 100-0% drive that indicated a capacity around 79kWh.
After about four mounths the BMS also learned and now the range and capacity is per my calc (494km / 78.4kWh nominal).

FE2CD943-591B-42EE-9071-7C51A5DC6ABF.jpeg


I know some say the BMS estimate is very exact, but i also know my BMS was about 3.5% to optimistic and then some time later it was about 3.5% pessimistic.
Now it is back on track, after a longer drive the SOC stays at more or less the same after sleeping so for now the BMS is on track.

Rollercoasting is probably Teslas choice of how to do it some times. In the end, it will show the correct number two times on every big bump, both when going up and when going down :rolleyes:
 
I hope you can relax despite the ’bumpy ride’. You know that the bumps is BMS estimation induced and not real changes in range/capacity.

I had one ’bump’, I guess I caused it myself.
The intent was to do an opposite BMS calibration to take the range down from full range (not really probable) and hoping it would settle at the real range. My own calculation said 78.5-79kWh( ~ 495km range), like this line.
Wen the range dropped, it dropped to about 480-485km and 75.7-77kWh which was clearly lower than my estimate.

During this time I could see that after a long drive, for example parking with 32%, the car would increase the SOC-number to 33% even before sleeping and after it slept it would be 34%. This indicates that the BMS is off, the capacity is estimated too small which cause a SOC calculation during driving to calculate to much SOC used.
I ”knew” this, also made a 100-0% drive that indicated a capacity around 79kWh.
After about four mounths the BMS also learned and now the range and capacity is per my calc (494km / 78.4kWh nominal).

View attachment 878732

I know some say the BMS estimate is very exact, but i also know my BMS was about 3.5% to optimistic and then some time later it was about 3.5% pessimistic.
Now it is back on track, after a longer drive the SOC stays at more or less the same after sleeping so for now the BMS is on track.

Rollercoasting is probably Teslas choice of how to do it some times. In the end, it will show the correct number two times on every big bump, both when going up and when going down :rolleyes:
I tried 3 times to recalibrate the BMS to stop some "not believable" NFP reading , 2 times when the NFP was in a strong DOWNtrend and 1 time when it was in UP-trend.
Discharged and left sub 0% , charged to 100% and left at about 90-95% some hours then discharged again.
But all the times if a downtred was the case the downtrend continued, the same during the Up-trend.
Now I'm in a UP-trend and today I'm at 77,5 NFP (490 km range) , and it's not a credible value.
@AAKEE , how I can recalibrate the BMS to read more credible values?
I don't know if you spoke about 32-33% in you example for a reason, but in my case (and also in this strong UPward trend ) the switch point is always around 32-33%. Here something happens and I have a lower Soc percentage (left at 33 , and after hours of rest I see 32% or less). The "expected remaining" are the same kWh and obviously (being the Soc less) the NFP goes UP.
 
I tried 3 times to recalibrate the BMS to stop some "not believable" NFP reading , 2 times when the NFP was in a strong DOWNtrend and 1 time when it was in UP-trend.
Discharged and left sub 0% , charged to 100% and left at about 90-95% some hours then discharged again.
If you leave it overnight sleeping with sentry off with single digit, does not need to be sub sero, and then charge to 90% and leave it sleeping for at least 2-3hrs?
And following days tjexsame but different SOC’s?
But all the times if a downtred was the case the downtrend continued, the same during the Up-trend.
Now I'm in a UP-trend and today I'm at 77,5 NFP (490 km range) , and it's not a credible value.
You have been at quite low SOC all the time?
Only Supercharging, do you get a full preheat each time?
The car was a 2021 M3P from what date?
@AAKEE , how I can recalibrate the BMS to read more credible values?
If your charging schedule produce a rolercoaster I suspect you could get a continued rolercoaster after a BMS calib.

I havent really bothered with BMS calibration, except for the two sleeps at -1.8/-2% to try to lower the NFP.
I guess other ppl is better of tipping about this, or follow that thread with ”how I got half my lost range back”.
I don't know if you spoke about 32-33% in you example for a reason, but in my case (and also in this strong UPward trend ) the switch point is always around 32-33%.
No, just used one drive as an example, arrived at work after a 240km drive and did read 32%. After a days sleep it had 34%. A sign that the BMS was off on the pessimistic side.
I had a similar arriving at 52%, leaving 9 hours later I had 54%.
Here something happens and I have a lower Soc percentage (left at 33 , and after hours of rest I see 32% or less). The "expected remaining" are the same kWh and obviously (being the Soc less) the NFP goes UP.

If the SOC adjusts down after longer drives following a sleep, it looks to me like the BMS is overestimating the capacity (if not too cold outside so the battery wont cool off very much).
I think it is possible to calculate the whereabouts of the true SOC if we know initial SOC, the kWh used, the arrival SOC and the after sleep SOC.
 
If you leave it overnight sleeping with sentry off with single digit, does not need to be sub sero, and then charge to 90% and leave it sleeping for at least 2-3hrs?
And following days tjexsame but different SOC’s?

You have been at quite low SOC all the time?
Only Supercharging, do you get a full preheat each time?
The car was a 2021 M3P from what date?

If your charging schedule produce a rolercoaster I suspect you could get a continued rolercoaster after a BMS calib.

I havent really bothered with BMS calibration, except for the two sleeps at -1.8/-2% to try to lower the NFP.
I guess other ppl is better of tipping about this, or follow that thread with ”how I got half my lost range back”.

No, just used one drive as an example, arrived at work after a 240km drive and did read 32%. After a days sleep it had 34%. A sign that the BMS was off on the pessimistic side.
I had a similar arriving at 52%, leaving 9 hours later I had 54%.


If the SOC adjusts down after longer drives following a sleep, it looks to me like the BMS is overestimating the capacity (if not too cold outside so the battery wont cool off very much).
I think it is possible to calculate the whereabouts of the true SOC if we know initial SOC, the kWh used, the arrival SOC and the after sleep SOC.
In my experience, the SOC adjusts based upon the environmental conditions. For example, I live by a lake, where in the temperate months it is generally cooler compared to the temps I see in the surrounding areas around me. After driving somewhere, and stopping for a few minutes, I'll see my SOC is higher by 0.5%. If I leave my car in a sunny spot, for several hours, I've seen it go up by 3%. Is it just basic chemistry? Higher ambients, lead to more freely moving electrons and higher battery voltages? Dunno, but why isn't it doing this recalculating dynamically as I drive?
IMG_6288.jpeg

Here's one of the new Energy graphs that shows it more clearly. I stopped at 27 miles and you can see when I got back in the car and started driving, the BMS recalculated that I had 2% more SOC. This happens all the time.

Interestingly, while the SOC has gone from 59% at 0 miles to 45% at 55 miles, for a total change of 14% SOC, it says I used 15.9%. That 2% difference is how much the SOC increased when I stopped.
 
  • Like
Reactions: DrGriz
In my experience, the SOC adjusts based upon the environmental conditions.

You mean like parking and SOC lowers when the battery cools of?

What I am talking about is that the BMS can not measure the exact SOC during the drive.
This is because the voltage droops very different depending on load and battery temperature, and also historic load one hour earlier in the drive affects the actual voltage.
So the car use mathematics to calculate the SOC.
Starting at 100% with a estimated capacity for example 80kWh and subtracting used energy 40kWh set the screen calculated SOC to 50%. (For this example we can disregard the buffer).
The screen will show 50% when parking.
If the capacity was only 76kWh because the BMS was not on track/badly ”calibrated” the on screen SOC will be shown to high.
Sometimes the car can se that the calculsted SOC is not corresponding to the voltage and adjust the SOC slightly during the drive, or when parking and reducing the power demand.
The OCV measurement when the car is sleeping will show the true SOC which will be lower than the calculated on screen SOC. Of course this will be decided by the Open Contactor Voltage but it probably will be about 40/77= 52% was used and therefore 48% will be the new on screen SOC.


This is an example iof this:
Arriving at work after a 237km drive:
The calculated SOC is 52%.
65860B42-6875-4C68-A6C1-CD1C89042020.jpeg


After a short while (~20min) the BMS sence that the calculated SOC is too low and readjust to 53%, even before sleeping:
0D901299-79BC-4F25-8D2C-0CCAFB34BA8A.jpeg


After a days work it was time to go home:
Actually the screen showed 54% when I started the drive.
C8C58797-DE43-44E5-BE42-A19445272AD8.jpeg


The temperature was very stable during this day due to a cloud layer, and the car was parked under a big carport (sun shade)
45E3AAAC-3D2A-4156-81A1-E3584AF27627.jpeg


The NFP was too low during this time, about 77kWh, and the days drive used 75.15 kWh (on screen in the car, teslafi do not give 100% correct numbers).
The BMS showed 3.8kWh remaining, parked with 0% on screen (0.27% according to BMS which climbed to 0.43% before I connected the charger. I was jet lagged and needed to sleep so I didnt let it sleep before connecting the charger.
The 100-0% drive indicated 78.85 kwh capacity. The difference between NFP and the was reflected by the SOC adjust after the first drive.
 
  • Informative
Reactions: KenC