I hope that is the problem. Tesla is supposedly looking into it.Looks like you are seeing 1 of 3 inverters. Tesla will need to fix it for you.


Welcome to Tesla Motors Club
Discuss Tesla's Model S, Model 3, Model X, Model Y, Cybertruck, Roadster and More.
Register
Install the app
How to install the app on iOS
You can install our site as a web app on your iOS device by utilizing the Add to Home Screen feature in Safari. Please see this thread for more details on this.
Note: This feature may not be available in some browsers.
-
Want to remove ads? Register an account and login to see fewer ads, and become a Supporting Member to remove almost all ads.
You are using an out of date browser. It may not display this or other websites correctly.
You should upgrade or use an alternative browser.
You should upgrade or use an alternative browser.
Solar production far less than expected
- Thread starter GuyHall
- Start date
BrettS
Active Member
3 inverters. I don't think it's mis-reporting as powerwall is filling up at the same rate.
Are there any tools to dig in deeper than the tesla app?
What type of inverters do you have? Do they have screens or lights? What’s on the screen or which lights are on for each of the inverters?
I don't think it's misreporting as it's filling up the powerwalls at the same rate as the generation.Definitely could be even more - was probably being a bit conservative, but basing it on the time of year and having a solar glass roof with similar layout (mine being 50/50 north/south) and the larger size (and, though thousands of miles away, similar latitude) and the data I've seen for our system. In any case, 30 is clearly low, and though I don't know the local smoke conditions (and possibly soot or other dirt on the tiles) it seems rather unlikely it would cut production so much.
Hopefully it does end up being something simple like turning on/rebooting an inverter.
To investigate the possibility of an inverter not properly reporting, it should be possible to compare production numbers in the Tesla app to what shows on the meter (or on the utility's website.) If they are way off (with the meter/utility showing much more solar generation) this could indicate things are working but an inverter is just not properly reporting its data to the app.
Is there a way to determine if all three inverters are working?
Spa but no pool. I have cars to recharge, though the mileage has dramatically dropped. I'm planning to replace our HVAC with an all electric unit. Ditto with the water heater and stove top.on another note 25MWh for the year is a lot of power. Hope OP can use it all otherwise they sold you too big a system
Probably has a big pool")
And, my wife who works nights needs a cold room to sleep during the day. Lastly there's the indulgence of the master bath floor heater that guilt has prevented us from having ever used.
SoCal Dave
Member
I don't think it's misreporting as it's filling up the powerwalls at the same rate as the generation.
Is there a way to determine if all three inverters are working?
Yes, move the red switch to the P position for 2 seconds to get an indication of the power produced.
You can also use the MySolarEdge app in read only mode for more details. Just be patient for the wifi to connect.
We have 15.4KW of solar panels. Our peak solar power is generally between 10.5 to 11 KW, with total solar power generation around 80 KWh on a completely sunny day (haven't had many of those this summer). So far this year (Jan 1 through Aug 24), we've generated 12.6MWh of solar power - which is below the projected 14.5 MWh that was modeled by our installers.
Our roof has many irregular shaped sections, limiting the number of solar panels facing almost completely due south, so we knew we had some panels that would get less sun during mornings - plus some panels that would get shade during the afternoon.
While we're not generating as much solar power as we had anticipated, we're satisfied with our system. We've slashed our electricity bills by at least 75% - and with a hurricane approaching, we're confident that with Storm Watch triggered and turning off non-essential devices, we'll be able to operate for days without grid power (which we did for several 5 day periods during the spring).
bkp_duke
Well-Known Member
Apologies for having started this in the rooftop layout thread, but I hope there might be some suggestions from the broader community. We just turned on our solar glass roof with three powerwalls. Expected generation to the some reasonable portion of the 21+ kW spec'd. We are seeing peak generation of less than 7 kW.
I haven't completely freaked out yet because of the smoke, and would expect some drop in production. However, this seems to be more than I would have expected.
I assume the Tesla contract numbers reflect the orientation of the roof and surroundings. They were:
One 365th of the annual 25,259 kWh would have an average daily production of about 70 kWh. One would expect August to be higher than the average, even with the smoke. We're seeing around 25 kWh to 39 kWh.
- Solar Roof system size: 21.98472 kW DC
- Estimated gross annual electricity production in kilowatt-hours (kWh) from your Solar Roof in Year 1: 25,259 kWh
Any suggestions?
I suspect you have a large portion of your solar generation that is non-optimal in orientation. And the smoke is likely impacting production substantially.
By comparison - we have the system in my signature below, and it is rated for 20,000 kwh per year, even though it is almost 1/2 the size of yours.
Orientation and (lack of) shading is critical.
buckets0fun
Active Member
You can add to SGv3, later, it will just be very expensive.If you have a solar roof then the solar capacity of the roof can’t be expanded later. If you have panels you can always add more panels, but it’s really more like just adding a second system rather than adding panels to your existing system. But as long as you have roof space left you could add another system with more panels and another inverter to supplement the original system.
They are labeled as teslaWhat type of inverters do you have? Do they have screens or lights? What’s on the screen or which lights are on for each of the inverters?
I don't know the vendor Tesla is using for the inverters, but I attached a photo. The solar LED is on most of the time and the lightening bolt blink irregularly.Do you have Solaredge inverters? I have their app setup and it gives details on how much each panel is producing for the day (also week, month, etc). Perhaps it can shed more light into why production is low.
One at a time I shut down two of the 3 inverters. Each time the reported generation dropped by about 2kW of the system's total 6+ kW.
Not looking good...
Attachments
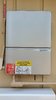
I don't know the vendor Tesla is using for the inverters, but I attached a photo in a prior post. The solar LED is on most of the time and the lightening bolt blink irregularly.What type of inverters do you have? Do they have screens or lights? What’s on the screen or which lights are on for each of the inverters?
One at a time I shut down two of the 3 inverters. Each time the reported generation dropped by about 2kW of the system's total 6+ kW.
That is a Delta M series inverter.They are labeled as tesla
I don't know the vendor Tesla is using for the inverters, but I attached a photo. The solar LED is on most of the time and the lightening bolt blink irregularly.
One at a time I shut down two of the 3 inverters. Each time the reported generation dropped by about 2kW of the system's total 6+ kW.
Not looking good...
I did the same test with mine trying to determine if the inverter was working. I had similar results. That is, production dropped as each inverter was dropped off. So the inverters are at least operational.
Unfortunately, if Telsa installed the system the data they send back is encrypted and not available for review. So, if it is a Tesla install, you should log an issue with them.
Last edited:
charlesj
Active Member
I didn't think of my system in MWh until now. 18.7MWh sounds like a lot more production than 18,700kWh.
In 64 years when I hit 1.21GWh produced, I'm going to have a huge Back to the Future party I'll also be nearly celebrating my 110th birthday so it might not happen.
Think positively that it will happen.
Just remind us when it happens as my brain will forget for sure.
niveknow
Member
I'm only a few days running and starting to take a look at my charts and searched the forum to land on this thread. Had similar questions on production.
I'm on 12.24 system on SolarEdge 11.4 inverter. While it's been less than ideal in Houston, I'm seeing afternoon production spikes in between 11ish kWH fairly consistently during the peak 1-2 hours. If I take raw math, I think my system is "efficient", but what's the real limiting device? Is it the inverter or actual panels? Panel math 340 wtt x 36 panels = 12.24 kWH and I'm getting fairly close to the panel specs but thinking maybe it's my inverter. Thoughts?
I'm on 12.24 system on SolarEdge 11.4 inverter. While it's been less than ideal in Houston, I'm seeing afternoon production spikes in between 11ish kWH fairly consistently during the peak 1-2 hours. If I take raw math, I think my system is "efficient", but what's the real limiting device? Is it the inverter or actual panels? Panel math 340 wtt x 36 panels = 12.24 kWH and I'm getting fairly close to the panel specs but thinking maybe it's my inverter. Thoughts?
charlesj
Active Member
Several reasons for not getting the most out of your peak panel production and daily production:I'm only a few days running and starting to take a look at my charts and searched the forum to land on this thread. Had similar questions on production.
I'm on 12.24 system on SolarEdge 11.4 inverter. While it's been less than ideal in Houston, I'm seeing afternoon production spikes in between 11ish kWH fairly consistently during the peak 1-2 hours. If I take raw math, I think my system is "efficient", but what's the real limiting device? Is it the inverter or actual panels? Panel math 340 wtt x 36 panels = 12.24 kWH and I'm getting fairly close to the panel specs but thinking maybe it's my inverter. Thoughts?
panel orientation, angle to horizontal, angle to sun at peak as we are almost 3 month past the sun's highest arc, weather,
Daily production: length of daylight. Longest day is Jun 20, shortest is Dec 20.
As to panel rating, that is in ideal condition in a lab measurement with fully lighting equally on all segments and perhaps temperature favorable to max production.
ps, forgot temperature, a big impact, and this is not the air temp on your outdoor thermometer.
pps,
that 11ish is almost the max inverter rating although inverters can go above that rating before clipping.
ppps,
if you divide that inverter rating to the number of panels, you get 317W per panel, so it seems you may be getting close to that and perhaps clips at 11.9kW
Last edited:
bkp_duke
Well-Known Member
I'm only a few days running and starting to take a look at my charts and searched the forum to land on this thread. Had similar questions on production.
I'm on 12.24 system on SolarEdge 11.4 inverter. While it's been less than ideal in Houston, I'm seeing afternoon production spikes in between 11ish kWH fairly consistently during the peak 1-2 hours. If I take raw math, I think my system is "efficient", but what's the real limiting device? Is it the inverter or actual panels? Panel math 340 wtt x 36 panels = 12.24 kWH and I'm getting fairly close to the panel specs but thinking maybe it's my inverter. Thoughts?
Post a graph. If you see a flat, horrizontal line, you are "clipping" and the inverter is your limiting factor.
Otherwise, I think you have forgotten to take into account efficiency losses from the DC to AC conversion (panels are DC, your measured production on the system is in AC).
I'm only a few days running and starting to take a look at my charts and searched the forum to land on this thread. Had similar questions on production.
I'm on 12.24 system on SolarEdge 11.4 inverter. While it's been less than ideal in Houston, I'm seeing afternoon production spikes in between 11ish kWH fairly consistently during the peak 1-2 hours. If I take raw math, I think my system is "efficient", but what's the real limiting device? Is it the inverter or actual panels? Panel math 340 wtt x 36 panels = 12.24 kWH and I'm getting fairly close to the panel specs but thinking maybe it's my inverter. Thoughts?
In ideal situation (weather, sun, panel angles, conversion loss), the limiting factor should be the lower of the inverter size and panels production limit. So, 11.4
BrettS
Active Member
I'm on 12.24 system on SolarEdge 11.4 inverter. While it's been less than ideal in Houston, I'm seeing afternoon production spikes in between 11ish kWH fairly consistently during the peak 1-2 hours. If I take raw math, I think my system is "efficient", but what's the real limiting device? Is it the inverter or actual panels? Panel math 340 wtt x 36 panels = 12.24 kWH and I'm getting fairly close to the panel specs but thinking maybe it's my inverter. Thoughts?
You have an 11.4kW inverter, so the most power the inverter can output would be 11.4kW. So if you are seeing a spike that hit 11.4kW then it’s possible that the inverter did get maxed out and that’s the limiting factor.
But for anything less than 11.4kW the limiting factor will be the panels (or, more accurately the sun). Even with 12.21kW of panels most of the time the panels will be producing considerably less than 12.21kW of power.
It’s also worth noting that if you are seeing spikes, rather than a smooth curve then you may be experiencing cloud edge effect. That is a phenomenon that occurs as clouds pass in front of the sun. When the sun is just behind the edge of the cloud the light can be refracted in a certain way that causes solar panels to temporarily produce more power than if the sun was shining directly on them. Of course this is a short lived effect as the clouds move, so it will appear as spikes in your graph.
niveknow
Member
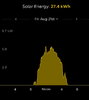
Here's today's graph. Still testing so PVs were off all day until it was turned on. Overall I wouldn't consider it a sunny day. .and yes those spikes may be the cloud edge, but I'm seeing respectable production given this time of year. Again I don't have enough data over time to recognize patterns, but do see the top end cap and hence my question.
And yes. I have all my panels on one roof facing the same direction. Westerly direction
And yes. I have all my panels on one roof facing the same direction. Westerly direction
Attachments
Similar threads
- Replies
- 8
- Views
- 2K
- Replies
- 14
- Views
- 2K
- Replies
- 72
- Views
- 3K