


Welcome to Tesla Motors Club
Discuss Tesla's Model S, Model 3, Model X, Model Y, Cybertruck, Roadster and More.
Register
Install the app
How to install the app on iOS
You can install our site as a web app on your iOS device by utilizing the Add to Home Screen feature in Safari. Please see this thread for more details on this.
Note: This feature may not be available in some browsers.
-
Want to remove ads? Register an account and login to see fewer ads, and become a Supporting Member to remove almost all ads.
You are using an out of date browser. It may not display this or other websites correctly.
You should upgrade or use an alternative browser.
You should upgrade or use an alternative browser.
Tesla BEV Competition Developments
- Thread starter uselesslogin
- Start date
-
- Tags
- TSLA

RobStark
Well-Known Member
The 3 largest global BEV manufactures.

"EV sales in mainland China will rise by 35 per cent this year to 8.8 million units, UBS analyst Paul Gong forecast in April."

I can't wait to see what things look like in a few years. Total vehicle sales were c.23m in 2021. At the rate they're increasing production volume they could be over 50% new vehicle sales penetration by 2025/6."EV sales in mainland China will rise by 35 per cent this year to 8.8 million units, UBS analyst Paul Gong forecast in April."
Doggydogworld
Active Member
35% sounds right, but 8.8m doesn't. NEV sales in China were 5.9-6.1m last year, depending on your source, so 35% growth would be 8.0-8.2m.
1H sales this year were 3.2m. July looks like 0.65m, up ~30% y/y. His 8.8m requires 1m/month average the last 5 months. That'd be +65% y/y, a dramatic acceleration from recent growth rates. I just don't see it. I still expect ~8m this year for 33% growth.
Europe is growing even slower, maybe 12%. US percentage growth will be high, but we're too small to move the global needle. At the start of the year I said 13-14m worldwide, for 30-40% growth. Might be a tad optimistic.
petit_bateau
Active Member
On the other hand, at global scale, the historical evidence best fits a 60-65% growth rate for EV at this point with a fantastic fit on the logistics curve. I appreciate that EV=BEV+PHEV in this calc; and I appreciate that NEV is not BEV or EV; and I appreciate that China is not the whole world. But still, that should be a whole lot of cars washing round looking for a35% sounds right, but 8.8m doesn't. NEV sales in China were 5.9-6.1m last year, depending on your source, so 35% growth would be 8.0-8.2m.
1H sales this year were 3.2m. July looks like 0.65m, up ~30% y/y. His 8.8m requires 1m/month average the last 5 months. That'd be +65% y/y, a dramatic acceleration from recent growth rates. I just don't see it. I still expect ~8m this year for 33% growth.
Europe is growing even slower, maybe 12%. US percentage growth will be high, but we're too small to move the global needle. At the start of the year I said 13-14m worldwide, for 30-40% growth. Might be a tad optimistic.
So whilst your 30-35% looks right for China, there could be room for an upside surprise.
(Something I'm very aware of in these calcs is that the Covid blip has hugely distorted the numbers, and we are very unsure what the post-Covid all-auto rate will return to, and how.)
==========
And wowsers, VAG strategy sessions must be easy pickings for a blind person with a dartboard in a cellar underneath a brewery.
RobStark
Well-Known Member
Doggydogworld
Active Member
Sorry, not happening. Logistics curves / S-Curves are common with consumer-driven transitions, but this one is government-driven. European regulators took their foot off the gas (oops, accelerator!) completely last year and China is now easing up as well. The US is accelerating, but too small to matter.On the other hand, at global scale, the historical evidence best fits a 60-65% growth rate for EV at this point with a fantastic fit on the logistics curve.
Look back and you'll see other government-driven discontinuities. China rewrote the rule book in mid-2018, flat-lining their EV sales from 2018-2020. Global growth was near-nil in 2019 and would have been in 2020 as well had Europe's 95g regs not kicked in with a vengeance.
NEV in China is BEV+PHEV+FCEV, which for all practical purposes means BEV+PHEV.I appreciate that EV=BEV+PHEV in this calc; and I appreciate that NEV is not BEV or EV
Besides NEVs they also have LSEVs (low speed EVs, basically lead-acid golf carts), but those don't count in the stats. I don't think LSEVs are even street legal in cities, just poor rural areas.
petit_bateau
Active Member
Thank you.Sorry, not happening. Logistics curves / S-Curves are common with consumer-driven transitions, but this one is government-driven. European regulators took their foot off the gas (oops, accelerator!) completely last year and China is now easing up as well. The US is accelerating, but too small to matter.
Look back and you'll see other government-driven discontinuities. China rewrote the rule book in mid-2018, flat-lining their EV sales from 2018-2020. Global growth was near-nil in 2019 and would have been in 2020 as well had Europe's 95g regs not kicked in with a vengeance.
NEV in China is BEV+PHEV+FCEV, which for all practical purposes means BEV+PHEV.
Besides NEVs they also have LSEVs (low speed EVs, basically lead-acid golf carts), but those don't count in the stats. I don't think LSEVs are even street legal in cities, just poor rural areas.
Those are good points, but I don't agree entirely.
Re S curves. In mixed economies - which is what most of the world really is - government-imposed top dow political decisions co-exist with bottom-up consumer conditions. So the historical S-curve dataset is fully representative of these mixed situations. Examples are that washing machines could not get bought until electrical grids became widely installed. Mobile phones did not take off until GSM/etc statndards were chosen and rolled out in core markets. Television until PAL/SECAM/etc broadcast standards and transmitters rolled out. LW/MW/FM radio until spectrum was allocated. Railway until laws passed to do the relevant landgrabs. Etc etc etc.
Also to the extent that one gov takes foot off accelerator another puts foot on. EU regs haven't really done a change, just that mfg are prioritising PHEV to try and squeeze max short term profit (and ignoring the train lights in the tunnel from oncoming Tesla + CN BEV)
Also this (BEV) is becoming substantially consumer driven, not just (if ever it was) top down diktat, globally.
Plus it is middle-driven as well. Industry pushes up to government, and down to consumer.
The combination of all this are - I think - why the aggregate global curve has become so smooth and such a good fit.
Nevertheless I too am cautious re the S curve. It was not until last year's data was in that I thought the match good enough to post the results. Previous years I was too concerned it wasn't representative. And I have still only dared to try fitting at global aggregate level because of the country-specific variations you mention.
Note my curve fit is on EV, not BEV. It is separately that I back out PHEV. FCEV I ignore as being near zero in practical terms. As I have previously written, the curve fit is very robust on EV#, EV%, and GWh. Which seems to leave Tot Vehicles as the biggest future unknown (ICE+EV), unless there is a major global discontinuity in GWh growth.
Therefore personally I think the biggest issue is the extent to which any post-Covid pent-up demand (is there any) is going into buying/making ICE business-as-usual rather than BEV/PHEV. There are a lot of folk out there who are keen to keep pushing everyone's heads back in the sand so as to delay adoption. Heck, my feed gets bombed by Aramco promoting 'clean' ICE vehicles the whole time. FUD is everywhere. Dino-makers are trying to buy time and golden parachutes, keep heads on despot necks/etc.
This is probably the biggest technology shift happening in the world during these one/two decades (ICE>BEV) (2020-2030 or 2015-2035 depending on how you count/etc). If this works fossil fuels will definitively wither as renewables will - as a side-effect - have enough stationary battery capacity to >90% replace fossils. That is at least as big a global technology paradigm shift as the rise of digital electronics; the introduction of widespread electricity; or the shift to coal-based-industrialised economies. So we should expect that the data and the reality are both hard fought over.
So I'm really surprised that this is not being more widely discussed. I've only seen one media article (the German one worrying about mind the gap) and no proper analysis in any of the consultancies in their public teasers. And academia seems to be veery slow in publishing. Omerta rules. Most odd. Mind you it took me years to pull together my dataset and I don't think that there are many of us with equivalent global datasets.
Nevertheless the data will tell us, year by year.
I've added in the % annual growth curve for interest. (to be specific - on the fitted S curve for simplicity)
We will see.
EDIT: besides which EV global for H1-2023 now at 19% so not far away from the full year 21% the S-curve predicted, and still 6-months to run (13% BEV, 6% PHEV)

World EV Sales Now 19% Of World Auto Sales! - CleanTechnica
Sign up for daily news updates from CleanTechnica on email. Or follow us on Google News! Global plugin vehicle registrations were up 38% in June 2023 compared to June 2022, rising to 1,260,00 units. In the end, plugins represented 19% share of the overall auto market (13% BEV share alone). ...
 cleantechnica.com
Last edited:

Someone thinks they found Totota's future battery.
It's a vanadium–titanium cathode, Li8Ti2V4O14. Titanium is common; vanadium technically has a higher crustal abundance than nickel, but it tends to be spread across low-quality deposits, so production is low right now. A review considering the resource outlook for V-based batteries [1] was guardedly optimistic. 750 Wh/kg is great. Vanadium cathodes historically had a problem with high dimensional instability, but it appears that cocrystallization with titanium may have fixed that, and the weird properties of vanadium became an advantage in compensating for Li+ influx/efflux.
Thank you.
Those are good points, but I don't agree entirely.
Re S curves. In mixed economies - which is what most of the world really is - government-imposed top dow political decisions co-exist with bottom-up consumer conditions. So the historical S-curve dataset is fully representative of these mixed situations. Examples are that washing machines could not get bought until electrical grids became widely installed. Mobile phones did not take off until GSM/etc statndards were chosen and rolled out in core markets. Television until PAL/SECAM/etc broadcast standards and transmitters rolled out. LW/MW/FM radio until spectrum was allocated. Railway until laws passed to do the relevant landgrabs. Etc etc etc.
Also to the extent that one gov takes foot off accelerator another puts foot on. EU regs haven't really done a change, just that mfg are prioritising PHEV to try and squeeze max short term profit (and ignoring the train lights in the tunnel from oncoming Tesla + CN BEV)
Also this (BEV) is becoming substantially consumer driven, not just (if ever it was) top down diktat, globally.
Plus it is middle-driven as well. Industry pushes up to government, and down to consumer.
The combination of all this are - I think - why the aggregate global curve has become so smooth and such a good fit.
Nevertheless I too am cautious re the S curve. It was not until last year's data was in that I thought the match good enough to post the results. Previous years I was too concerned it wasn't representative. And I have still only dared to try fitting at global aggregate level because of the country-specific variations you mention.
Note my curve fit is on EV, not BEV. It is separately that I back out PHEV. FCEV I ignore as being near zero in practical terms. As I have previously written, the curve fit is very robust on EV#, EV%, and GWh. Which seems to leave Tot Vehicles as the biggest future unknown (ICE+EV), unless there is a major global discontinuity in GWh growth.
Therefore personally I think the biggest issue is the extent to which any post-Covid pent-up demand (is there any) is going into buying/making ICE business-as-usual rather than BEV/PHEV. There are a lot of folk out there who are keen to keep pushing everyone's heads back in the sand so as to delay adoption. Heck, my feed gets bombed by Aramco promoting 'clean' ICE vehicles the whole time. FUD is everywhere. Dino-makers are trying to buy time and golden parachutes, keep heads on despot necks/etc.
This is probably the biggest technology shift happening in the world during these one/two decades (ICE>BEV) (2020-2030 or 2015-2035 depending on how you count/etc). If this works fossil fuels will definitively wither as renewables will - as a side-effect - have enough stationary battery capacity to >90% replace fossils. That is at least as big a global technology paradigm shift as the rise of digital electronics; the introduction of widespread electricity; or the shift to coal-based-industrialised economies. So we should expect that the data and the reality are both hard fought over.
So I'm really surprised that this is not being more widely discussed. I've only seen one media article (the German one worrying about mind the gap) and no proper analysis in any of the consultancies in their public teasers. And academia seems to be veery slow in publishing. Omerta rules. Most odd. Mind you it took me years to pull together my dataset and I don't think that there are many of us with equivalent global datasets.
Nevertheless the data will tell us, year by year.
I've added in the % annual growth curve for interest. (to be specific - on the fitted S curve for simplicity)
We will see.
View attachment 961890
EDIT: besides which EV global for H1-2023 now at 19% so not far away from the full year 21% the S-curve predicted, and still 6-months to run (13% BEV, 6% PHEV)
World EV Sales Now 19% Of World Auto Sales! - CleanTechnica
Sign up for daily news updates from CleanTechnica on email. Or follow us on Google News! Global plugin vehicle registrations were up 38% in June 2023 compared to June 2022, rising to 1,260,00 units. In the end, plugins represented 19% share of the overall auto market (13% BEV share alone). ...
As you say this shift is comparable to some other titanic shifts in technology like adoption of semiconductors or the building of coal based industry, but the technologies those were replacing were not core industries with a lot of economies relying on them. Coal didn't have to fight big tree for fuel dominance. At the time coal came into heavy use, de-forestation had become a big problem and there were shortages of trees to make ships. Burning wood for fuel was a limited resource and coal was a much better alternative.
Semiconductors replaces much bulkier and harder to use vacuum tubes. There were some companies built around vacuum tubes, but semiconductors being a vastly better solution except for some very high power applications saw vacuum tubes go by the wayside.
There are a lot of players who have deep economic stakes in the fossil fuel industry that are reluctant to let them go. Not only are many countries with oil based economies like the Gulf states, Russia, Venezuela, etc., but there are a lot of other players who are fully dependent on income from oil and gas to survive. One small example I saw something a few years ago that the US state of New Mexico saw a lot of oil wealth from the shale oil boom and they went and funded all state education programs with the money. At the time oil prices were down and a lot of the oil shale wells were shut in which was starving the schools.
There are a lot of other examples around the world where various things are tied to oil money that will go away when we quit using it.
The only other cases where this happened are much smaller. The shift from film based photography to digital photography bankrupted Kodak. A lot of people blame Kodak for short shortsightedness, but my father was a professional photographer who became a photographic supply dealer in his late career (from his early 60s to 85). He had a direct wholesale account with Kodak and got visited by reps at least once a month.
He was popular with the reps because he was a frustrated engineer. He tested everything and gave lots of feedback on new products. The reps told him a lot of insider information about what was going on at Kodak. Kodak saw digital photography coming before anyone else, but they were helpless to change enough to make the transition. Film photography requires a long tail of supplies from film, to processing chemicals, to processing equipment, to photographic paper. About 20% of my father's business was film, the rest of it was processing supplies. I was called upon to help ship stuff out when I was a teenager and I lugged a lot of 5 gallon containers of processing chemicals.
The switch to digital photography eliminated the tail of other supplies. Before most people just used their phones there was a period where people had separate cameras with media, and there still is a market for digital cameras for pro and enthusiast use. I have several digital Nikons within a few meters of me right now. The switch to cell phone cameras eliminated most of the low end cameras.
Kodak still exists to supply the now tiny film market. There are some uses for film and a small but dedicated hobby user world. Many Kodak employees now work for Tesla ironically. Kodak's main film factory was in Rochester New York. The film manufacturing workforce was mostly blind people because they could work in the dark with no added handicap. Solar panels also need to be made in the dark which is why SolarCity built their factory in Rochester to take advantage of the blind workforce that was already there.
The other film makers surfed the change to digital a little better because they were branches of larger companies that could take the hit. Fuji film being the largest competitor.
What happened to Kodak is likely going to happen to the entire oil industry and all other industries that are tied to it. Oil won't go away for a long time because we have no good alternative to oil for long distance shipping and aircraft. I know there are some ideas about powering ships with ammonia rather than bunker sea but it's going to be a long time before there is enough abundance of renewable energy to power enough ammonia plants to make a big difference in bunker sea replacement.
There are also a very, very large number of ICE land vehicles to replace. In the US there are a lot of ancient cars on the road, mostly driven by the working poor. The other day I came out of the store and saw one of these cars parked next to mine. It was about a 1990 Toyota with big patches of paint missing and the upholstery in poor shape. I thought it's going to be a very long time before that guy is driving an EV.
But EVs will take over new sales within a decade and renewables will become an ever growing slice of the energy generation pie over the same time. And we will see oil begin to decline. The transition will be slower than it was from film to digital photography, but the economic impact of the change will be much bigger.
In its heyday Kodak was a big company, but it was never a top Fortune 500 company. I think it made it to #30 once in the mid-1970s, but that was its peak.
I remember looking at the Fortune 500 when I was a kid. My father was always interested in investing, so that kind of info was around. I noted that each year the top 10 was dominated with companies involved in transportation: oil, cars, and/or aircraft. Year after year it was the same clump dominating the top ranks. Many of the heavy hitters from my childhood have merged with other companies or dropped from the highest reaches of the 500, but the top 20 still has three oil companies.
The shift is going to be an economic earthquake bigger than anything we've ever seen before. A lot of people with their hands in the fossil fuel pie are scared of what comes next for them. It will result in some economic disasters as oil revenue dries up.
I'm not saying we don't need to do it. We do, even setting aside CO2 impacts. We are using up all the easy to get oil and finding more is getting more and more expensive. The non-CO2 environmental impacts from using oil are high too: it's linked to asthma, possibly cancer, and loose oil in the environment damages wildlife. I can also see why many people are resisting the change.
RobStark
Well-Known Member
This is Fisker Product Vision Day 1 hour 36 minute presentation reduced to 11 minutes.
It shows the Ocean Offroad edition, the Ronin hardtop convertible with rear mounted rear doors, the Alaska pickup, plus PEAR subcompact crossover.
If Fisker was not partnered with Magna and Foxconn I would say this is pure fantasy.
It shows the Ocean Offroad edition, the Ronin hardtop convertible with rear mounted rear doors, the Alaska pickup, plus PEAR subcompact crossover.
If Fisker was not partnered with Magna and Foxconn I would say this is pure fantasy.
Knightshade
Well-Known Member
Given they've already cut production estimates for the one (money losing) vehicle Magna makes for em, and they're already raising cash again, still seems pretty fantastic to me... They post Q2 results today though so we'll see how their cash on hand and burn rate look I guess.
RobStark
Well-Known Member
RobStark
Well-Known Member
Given they've already cut production estimates for the one (money losing) vehicle Magna makes for em, and they're already raising cash again, still seems pretty fantastic to me... They post Q2 results today though so we'll see how their cash on hand and burn rate look I guess.
All BEV startups lose money at the beginning. That is a given.
Most BEV startups go to the capital markets again and again, many several times per year.
Chances of 2 or more of these vehicles making it to customer hands are slim. But not in the realm of fantastical.
Knightshade
Well-Known Member
All BEV startups lose money at the beginning. That is a given.
Tesla had a positive gross margin on the vehicles almost from the begining of mass production- though it took years for the overall company to be profitable.
Tesla was making money on each car very early in other words, and as long as they could scale to more total cars sold profit would happen.
AFAIK Rivian is still losing money on each car on TOP of the other costs of building a company- so if they scale up they lose MORE, and they keep scaling back their targets as a partial result.
To Fiskers credit they claim they DO have a positive gross margin- though they keep cutting production targets anyway (almost in half now for this year)
Last edited:
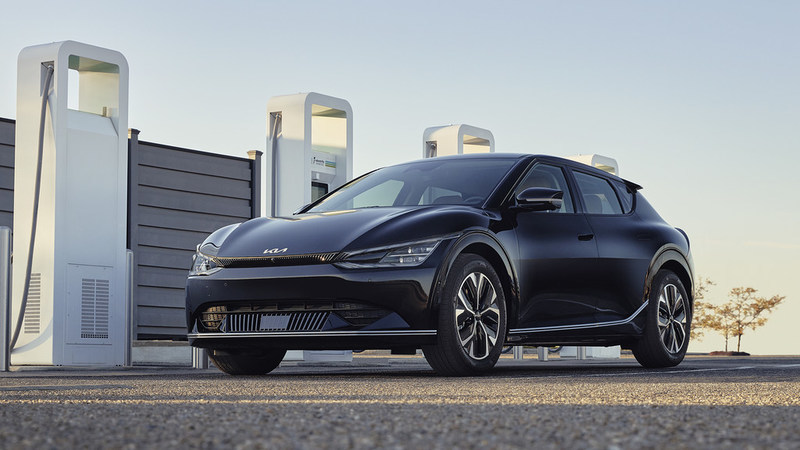
It seems like Hyundai/Kia have charge port issues:
 driveteslacanada.ca
Maybe they should switch to NACS...
Hyundai, Kia, and Genesis facing class-action suit over malfunctioning charging ports
Some owners of Hyundai, Kia, and Genesis electric vehicles (EVs) in the US are not happy with their purchases. They have come together to drag the three manufacturers before the courts over models with defective [...]
driveteslacanada.ca
Maybe they should switch to NACS...
Doggydogworld
Active Member
They will when Superchargers support 800V. Until then the Supercharging experience sucks for their eGMP cars.Maybe they should switch to NACS...
Similar threads
- Replies
- 10
- Views
- 959
- Replies
- 51
- Views
- 2K
- Replies
- 16
- Views
- 2K