The problem is that they can't show a profit without those fees because most charging is done at home. So they rely on apartment dwellers (which is temporary because apartments and condos will sooner than later be forced to put in charging if they want tenants) and low selling short range BEVs that have difficulty running in town without a charge stop. Typically their charging stations are in the wrong place for trips, although it's somewhat better now (as range increases, there will be less need). It's hard to imagine a worse place to invest in (as far as EVs go) than a for-profit charging network (that isn't run by a car manufacturer).IMHO I won't use third-party fast-charging stations until they get rid of the stupid subscription requirements with phone app, the initial hook-up fees, and their (often) opaque and/or downright exorbitant fee structures.


Welcome to Tesla Motors Club
Discuss Tesla's Model S, Model 3, Model X, Model Y, Cybertruck, Roadster and More.
Register
Install the app
How to install the app on iOS
You can install our site as a web app on your iOS device by utilizing the Add to Home Screen feature in Safari. Please see this thread for more details on this.
Note: This feature may not be available in some browsers.
-
Want to remove ads? Register an account and login to see fewer ads, and become a Supporting Member to remove almost all ads.
You are using an out of date browser. It may not display this or other websites correctly.
You should upgrade or use an alternative browser.
You should upgrade or use an alternative browser.
Tesla, TSLA & the Investment World: the Perpetual Investors' Roundtable
- Thread starter AudubonB
- Start date
MTL_HABS1909
Active Member
The manipulation this morning is blatantly obvious. Anytime TSLA gets within a few cents of going green, it is shoved down a few dollars. Only a matter of time....
JusRelax
Active Member
Difference being that one company is already producing the cells that enable this and are heading to mass-production. They also happen to be the world-leader in BEV's and are building factories around the world to try and catch up with demand.
Go figure...
Here's the kicker:
TSLA down as much as 9% the day after battery day
VW up as much as 29% after power day
With headlines like this on my yahoo Tesla feed lol:
Last edited:
asburgers
Sell order in at $8008.5
It is down on super low volume...we need some volume.The manipulation this morning is blatantly obvious. Anytime TSLA gets within a few cents of going green, it is shoved down a few dollars. Only a matter of time....
Here's the kicker:
TSLA down as much as 9% the day after battery day
VW up as much as 20% after power day
/s

European stocks rise as upbeat forecast from Volkswagen spurs rally in autos
European stocks rose on Tuesday as an upbeat forecast from German carmaker Volkswagen prompted a rally in the automobiles sector, while investors awaited the U.S. Federal Reserve's views on a recent pickup in inflation.
 www.reuters.com
(VW also had earnings today)
StealthP3D
Well-Known Member
I don't think Tesla's Supercharger Network is pricing for a loss - it's all the cars with established legacy free supercharging for life and the continual expansion costs of the network that push it into a small loss. Tesla will continue to operate the network at or near breakeven while continuing to subsidize the expansion of the network and free Supercharging for life cars with new car sales. Tesla production costs are low enough, relative to the competition, that they can to continue to do this and it doesn't add up to much per vehicle.Wondering what the thought is about charging prices....I do believe that non SC charging infrastructure is imminent. VW or GM or 3rd party or government subsidized or whatever. I believe Tesla currently offers SC pricing at a loss in many US venues (I don’t have a clue regarding non US pricing). I suspect that the upcoming non-SC chargers will not be at a loss and therefore higher priced, possibly significantly. Would you predict Tesla will raise their prices or continue to subsidize them?
Additionally, the new sales do not come with free-Supercharging and are growing so rapidly relative to early sales with free charging, they are quickly neutralizing the negative contribution of those who charge for free.
Competing networks are priced to discourage use. And they still don't seem able to maintain the chargers and keep them functional.
All of this adds up to be a stealth net positive for Tesla. Car reviewers will continue to compare non-Tesla EV's to a Tesla while largely ignoring the differences in charging networks. The consumer, meanwhile, will continue to have a magnetic preference for Tesla's, in part, due to the difference in charging networks. Because many new EV buyers feel their "road trip" freedom is threatened by the move to an EV and Tesla's fast-charging network alleviates that fear so much better than the competing networks.
Artful Dodger
"Neko no me"

Tesla Faces Yet Another NHTSA Probe Over 'Violent Crash' In Detroit
A “violent crash” involving a Tesla Inc (NASDAQ: TSLA) vehicle is under investigation by the National Highway Traffic Safety Administration, Reuters reported Monday. What Happened: The automobile safety agency in the United States said Monday that it had taken cognizance of the “violent crash...finance.yahoo.com
Yeah, this morning's action is more likely about the Options peak at the $700 strike price. Here is the Options trading volume so far today: (10:41 a.m. EDT)
With today's low trading volume in shares, it's easier for Options writers to manipulate the SP in their favor. Look at the spike of Open Interest at the $700 strike price: (OI data as of 7 a.m. today)
Finally, we look at the 11:00 am share price and we see where this is tending: (will take news to break out IMO)
Finally, there were 1.467M open Options contracts as of 7 a.m. today. That's 4-5x normal OI (open interest), and is largely due to this week's options expiries being on a "triple-witching" Friday:
Triple witching is the simultaneous expiration of stock options, stock index futures, and stock index option contracts all on the same day. It happens four times a year: on the third Friday of March, June, September, and December.
TL;dr come on, ARK/Cathie! ya kno ya want to drop those numbers...

Cheers!
Last edited:
G
goinfraftw
Guest
I was looking at this chart: United States Total Vehicle Sales | 1993-2021 Data | 2022-2023 Forecast | Calendar

...and it made me wonder a few thoughts:
- 2-year average is ~15M cars sold monthly
- Beginning of pandemic: ~15.3M (about a full month) cars were not sold that would have been in a normal year.
- That's a 12% loss on the market for a given year
- KBB says 2019 ASP of a new vehicle is ~$38k
- So, $581.4B of lost market revenue in 2020 give-or-take due to the pandemic shock.
My theory:
With the transition towards EV transitioning at a snail's pace over the next few years, these car sales numbers are going to get wonky. I suspect people are going to need to make a transitional decision to even purchase a vehicle compared to getting a ride anywhere. The pandemic doesn't make things easy either; no one wants to go to crowded public transit and get COVID...so how do you travel?
I think ridesharing services are going to do incredibly well over the next few years while the EV train ramps up. Further, I'm looking into two other areas that are peculiar in this macro situation which I don't fully understand and still researching (thoughts are welcome):
- Bank deposits (if you avg out the # of US adults and cash in banks...its around an astounding $75k):

- Trading Volume in the stock market (specifically NASDAQ here) last 5-years (I put it into an ugly chart below):

 finance.yahoo.com

...and it made me wonder a few thoughts:
- 2-year average is ~15M cars sold monthly
- Beginning of pandemic: ~15.3M (about a full month) cars were not sold that would have been in a normal year.
- That's a 12% loss on the market for a given year
- KBB says 2019 ASP of a new vehicle is ~$38k
- So, $581.4B of lost market revenue in 2020 give-or-take due to the pandemic shock.
My theory:
With the transition towards EV transitioning at a snail's pace over the next few years, these car sales numbers are going to get wonky. I suspect people are going to need to make a transitional decision to even purchase a vehicle compared to getting a ride anywhere. The pandemic doesn't make things easy either; no one wants to go to crowded public transit and get COVID...so how do you travel?
I think ridesharing services are going to do incredibly well over the next few years while the EV train ramps up. Further, I'm looking into two other areas that are peculiar in this macro situation which I don't fully understand and still researching (thoughts are welcome):
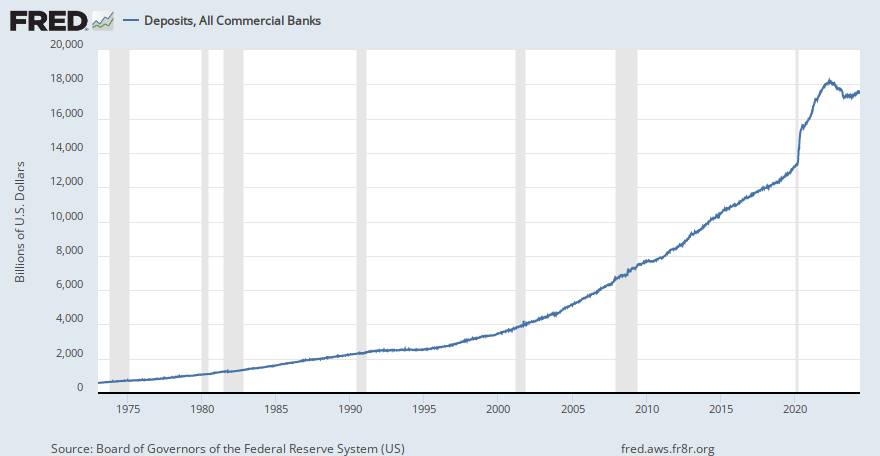
- Bank deposits (if you avg out the # of US adults and cash in banks...its around an astounding $75k):
Deposits, All Commercial Banks
Graph and download economic data for Deposits, All Commercial Banks (DPSACBW027SBOG) from 1973-01-03 to 2024-03-27 about deposits, banks, depository institutions, and USA.
fred.stlouisfed.org
- Trading Volume in the stock market (specifically NASDAQ here) last 5-years (I put it into an ugly chart below):
NASDAQ Composite (^IXIC) Historical Data - Yahoo Finance
Get historical data for the NASDAQ Composite (^IXIC) on Yahoo Finance. View and download daily, weekly or monthly data to help your investment decisions.
I was looking at this chart: United States Total Vehicle Sales | 1993-2021 Data | 2022-2023 Forecast | Calendar
View attachment 644905
...and it made me wonder a few thoughts:
- 2-year average is ~15M cars sold monthly
- Beginning of pandemic: ~15.3M (about a full month) cars were not sold that would have been in a normal year.
- That's a 12% loss on the market for a given year
- KBB says 2019 ASP of a new vehicle is ~$38k
- So, $581.4B of lost market revenue in 2020 give-or-take due to the pandemic shock.
My theory:
With the transition towards EV transitioning at a snail's pace over the next few years, these car sales numbers are going to get wonky. I suspect people are going to need to make a transitional decision to even purchase a vehicle compared to getting a ride anywhere. The pandemic doesn't make things easy either; no one wants to go to crowded public transit and get COVID...so how do you travel?
I think ridesharing services are going to do incredibly well over the next few years while the EV train ramps up. Further, I'm looking into two other areas that are peculiar in this macro situation which I don't fully understand and still researching (thoughts are welcome):
- Bank deposits (if you avg out the # of US adults and cash in banks...its around an astounding $75k):
Deposits, All Commercial Banks
Graph and download economic data for Deposits, All Commercial Banks (DPSACBW027SBOG) from 1973-01-03 to 2024-03-27 about deposits, banks, depository institutions, and USA.fred.stlouisfed.org
View attachment 644915
- Trading Volume in the stock market (specifically NASDAQ here) last 5-years (I put it into an ugly chart below):
NASDAQ Composite (^IXIC) Historical Data - Yahoo Finance
Get historical data for the NASDAQ Composite (^IXIC) on Yahoo Finance. View and download daily, weekly or monthly data to help your investment decisions.
View attachment 644914
The 15 to 16 mln cars sold in the US is the number per year, not per month. The numbers you quote for January and February are probably moving averages based on monthly sales.
G
goinfraftw
Guest
The 15 to 16 mln cars sold in the US is per year, not per month. The numbers you quote for January and February are probably moving averages based on monthly sales.
It's hard to tell on the charts...though thanks. So, would that mean that March - May numbers are likely much lower, in the count, for those months...as well as the rest of 2020 as the moving averages have decreased throughout?
From your link above:It's hard to tell on the charts...though thanks. So, would that mean that March - May numbers are likely much lower, in the count, for those months...as well as the rest of 2020 as the moving averages have decreased throughout?
"In the United States, Total Vehicle Sales measures the annualized number of new vehicles sold domestically in the reported month."
If you have FSD, the current AP stops at every light regardless of colour. It's why I don't use it on surface streets--just too annoying. FSD Beta fixes that. So there's plenty of room for confusion AP, AP+FSD, FSD Beta.When did AP start stopping for traffic lights ?
Thought you had to have FSD for AP to stop at intersections ?
j6Lpi429@3j
Closed
Re: VW and charge networks etc. I think its very easy for all us EV-geeks to forget just how clueless the average car buyer who isn't into EVs or tesla really is. (I talk to such people regularly). The #1 best amazing marketing thing did tesla did long ago was to slap a great big ILLUMINATED sign on the top of all its charging posts with TESLA written on it.
Can you charge a nissan leaf at an ionity? what about a renault zoe at a chargepoint? what about a porsche at an ecotricity? who knows! who cares! But everyone assumes, quite rightly that when they buy a tesla, they can charge it at those big shiny tesla charge-points they have been seeing pop up for YEARS now...
When a car company talks about a 'partnership' or even a 'strategic partnership' with a charging network, they *just dont' get it*. Tesla have set the standard, and people will expect to have a Volkswagen charge network for their Volkswagen car. But thats not going to happen.
UkNorthampton
TSLA - 12+ startups in 1
The problem is that they can't show a profit without those fees because most charging is done at home. So they rely on apartment dwellers (which is temporary because apartments and condos will sooner than later be forced to put in charging if they want tenants) and low selling short range BEVs that have difficulty running in town without a charge stop. Typically their charging stations are in the wrong place for trips, although it's somewhat better now (as range increases, there will be less need). It's hard to imagine a worse place to invest in (as far as EVs go) than a for-profit charging network (that isn't run by a car manufacturer).
Free charging, energy arbitrage through batteries + coffee & cake shop/burgers/small retail etc
asburgers
Sell order in at $8008.5
I have found that if it is behind a car it will continue through a green light. If not a quick flip of AP stalk or touch on gas pedal and it will go through green light as well. I use it all the time on city street's...love it.If you have FSD, the current AP stops at every light regardless of colour. It's why I don't use it on surface streets--just too annoying. FSD Beta fixes that. So there's plenty of room for confusion AP, AP+FSD, FSD Beta.
How many presidents are there within Tesla?
Seems something is in the wind related to titles.
Could this have something to do with X Corp? Perhaps the beginning of a title structure that will one day be a business group structure?
How the hell does he know what everyone inside Tesla thinks....Gary is a blowhard.
Similar threads
- Locked
- Replies
- 0
- Views
- 3K
- Locked
- Replies
- 0
- Views
- 6K
- Replies
- 6
- Views
- 5K
- Replies
- 6
- Views
- 11K
- Locked
- Replies
- 27K
- Views
- 3M