This arrived just now by email from one of the technical analysts I used to interview on my TV show.
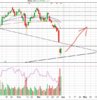
Today the Total Put/Call ratio closed at 1.26 which has led to higher markets 92% of the time in the next five days with an average gain of 1.8%. We have two different Put/Calls ratio (Index and Total) that suggests a bottom is near. Long SPX on 3/22/18 after market close at 2643.69.
Tim Ord’s website: http://www.ord-oracle.com/