Highway2Heel
Member
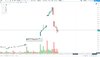
I’m sorry....my comment was without context and not very on point. I saw a flag days ago when we were range bound for a time and then broke out. My understanding is there can be a correction of 10-25% followed by another breakout.
I’ll admit, my knowledge here is sketchy since we don’t see these patterns very often. I’m glad to be enlightened further.
I’ll admit, my knowledge here is sketchy since we don’t see these patterns very often. I’m glad to be enlightened further.