@AlanSubie4Life, I hear you and couldn't agree more. As owners, we should be able to speak what is on our mind, and you raise a very good point. If Tesla can address this so that the drain is some fraction of what it is now, that would be a very good thing. Keeping in mind that your comparison with the smaller Chevy EV is probably not fair as the two cars have a completely different feature set. If you log into your account, and click on the manage button, you will see another button to "ask a question", or something like that. That is probably one of the easiest ways to reach out to Tesla. You will know you are in the right place, because you will also be able to not only send it to Tesla customer support, but raise the issue up to higher management. I got a very fast response after sending in a question of my own.


Welcome to Tesla Motors Club
Discuss Tesla's Model S, Model 3, Model X, Model Y, Cybertruck, Roadster and More.
Register
Install the app
How to install the app on iOS
You can install our site as a web app on your iOS device by utilizing the Add to Home Screen feature in Safari. Please see this thread for more details on this.
Note: This feature may not be available in some browsers.
-
Want to remove ads? Register an account and login to see fewer ads, and become a Supporting Member to remove almost all ads.
You are using an out of date browser. It may not display this or other websites correctly.
You should upgrade or use an alternative browser.
You should upgrade or use an alternative browser.
Vampire Drain/Loss Tracking
- Thread starter HopeToGolf
- Start date
AlanSubie4Life
Efficiency Obsessed Member
@AlanSubie4Life, Keeping in mind that your comparison with the smaller Chevy EV is probably not fair as the two cars have a completely different feature set.
I'll contact Tesla! Regarding the Spark EV, I don't think the feature set has any bearing on the vampire drain, as the car is off. Doesn't really have any features when the car is off. So it shouldn't have any drain!
AlanSubie4Life
Efficiency Obsessed Member
Guys, it may have been mentioned before, but all modern cars have vampire drain. The battery in a Lexus or MB will run flat if you leave it for an extended time. Yes a Tesla will drain somewhat more as it is monitoring a lot more things and may have to wake up occasionally. The first rule of storing a Tesla is leave it alone. Waking it causes much more drain. My S was not plugged in for a month and driven 17 miles by the forwarder and only lost 50 miles of range.
The lead acid battery was discussed earlier in this thread; different order of magnitude entirely and the comparison makes the vampire drain issue look even worse!
“Monitoring a lot more things” - this is vague and kind of the point of this thread. It would be very helpful to know what is actually going on and to be able to control it as needed.
Your 33 miles of drain over a month would be good when compared to the Model 3, but still equates to about 15W average drain, which is pretty awful in an absolute sense. Still, would be a great start to *consistently* get that level with the Model 3. That does sometimes seem to occur...but it is inconsistent.
BestHand
Member
Somewhere in a manual it reads that from time to time Tesla runs some tests while parked. I wish I have some switch/screen button to quickly stop any activity except probably bluetooth. It would make drain level close to cell phone which is pretty low. It does not really matter if the car would check for updates or make some test later. I would use that switch when I know that the car parked in garage in good temperature conditions and I can wait a bit longer to car awake if needed it.It would be very helpful to know what is actually going on and to be able to control it as needed.
Daniel in SD
(supervised)
I bet if the EPA included vampire drain in the MPGe ratings the problem would get fixed real quick. 3 miles a day is day is over 1000 miles a year. Lower the MPGe by 5-10%.
As a point of reference the vampire drain on a cellphone is less than 0.1W with cellular, Wi-Fi, and Bluetooth running. It takes a lot less time to wake up than a Model 3 too!
As a point of reference the vampire drain on a cellphone is less than 0.1W with cellular, Wi-Fi, and Bluetooth running. It takes a lot less time to wake up than a Model 3 too!
Good point @AlanSubie4Life, more to my point though, I was meaning more the Tesla. These cars are monitoring things with some frequency as has already been pointed out, Tesla says that a 1% drain/day is normal. I completely agree with you, that does seem like a lot. I especially agree with your point about the conservation side of things with more cars being registered, this is very likely going to become an ever increasingly important issue. It would be nice to see Tesla apply efforts to minimize the normal drain with these cars.I'll contact Tesla! Regarding the Spark EV, I don't think the feature set has any bearing on the vampire drain, as the car is off. Doesn't really have any features when the car is off. So it shouldn't have any drain!
I was out of town the last 3 days and my car was parked in my NorCal garage. I'm at 2018.42.4. Here's the data I took:

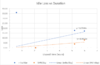
I also split out the idle and sleep times and plotted them vs the duration of the event. The linear trend lines don't fit the data at all, I just wanted to see what the Excel thinks the formula would be.

and

This is all taken by TeslaFi.
I also split out the idle and sleep times and plotted them vs the duration of the event. The linear trend lines don't fit the data at all, I just wanted to see what the Excel thinks the formula would be.
and
This is all taken by TeslaFi.
Attachments

AlanSubie4Life
Efficiency Obsessed Member
I was out of town the last 3 days and my car was parked in my NorCal garage. I'm at 2018.42.4. Here's the data I took:
View attachment 359338
I also split out the idle and sleep times and plotted them vs the duration of the event. The linear trend lines don't fit the data at all, I just wanted to see what the Excel thinks the formula would be.
View attachment 359340
and
View attachment 359344
This is all taken by TeslaFi.
Interesting. Looks like this explains the inconsistency I see (I don’t run apps so I don’t have this visibility). The higher draw seems to be dominated by the idle periods.
I ignored the first 30 minute idle period.
Looks like the vampire draw is dominated by the 5 hour idle periods, which draw ~160W.
The sleep mode appears to be closer to an average of 12W, though it can be a few watts higher or lower.
For this 77 hour time period, the overall average was 33.5W.
I’m not sure I would have fitted the data this way. Haven’t really thought about it, but I think it is better to fit the raw kW & miles data, rather than the number Tesla Fi extrapolates to a “per day” number (kWh/day and miles/day). You’d get a slope that is the average number of watts for each mode if you used the other data.
For the data you fit: In theory, for sleep mode, the value should be pretty much the same mi/day or kWh/day loss, regardless of the length of the sleep period (because presumably sleep mode uses a particular number of watts). Now, that clearly isn’t the case here exactly, and there may be some overhead entering/leaving a state.
What I said is a bit confusing - anyway, I think it’s best to break it down to average watts in each mode, as above.
Thanks for the data!
So sleep mode consumption is awful (12W), and in the event you also get a brief (5 hour!) idle event you really get screwed.
Still, 12W would be a start! If only we could avoid the idle events!
And your results indicate that TeslaFi isn’t really impacting your vampire drain since the results are similar to mine.
I'll be out of town for two weeks and I'll leave it unplugged and try not to wake it up with the app, so we can get even more sleeping/idle power consumption.I was out of town the last 3 days and my car was parked in my NorCal garage.
jcal0820
ride the wave
Just flew out again and left the ME in a public parking lot, @ 236 miles of range when I left. Will see what it'll be in 2 days after I return.
StealthP3D
Well-Known Member
The 125k Tesla Model 3s manufactured thus far are likely introducing an average load of 5MW to the nation's energy consumption when they're not even being used. Small potatoes right now, but not nothing!
To put it into perspective, the vampire drain on the average Model 3 consumes less electricity than it takes to refine the gasoline that one ICE car would consume. People forget that oil refining is very electrically intensive. Anti-EV zealots like to claim EV's are "coal powered". Funny how they never mention how much "coal power" it takes to refine all the gasoline for ICE vehicles. That's why oil refineries have their own power sub-stations.
All EV's have vampire drain and more EV's with vampire drain is a GOOD thing!
AlanSubie4Life
Efficiency Obsessed Member
To put it into perspective, the vampire drain on the average Model 3 consumes less electricity than it takes to refine the gasoline that one ICE car would consume. People forget that oil refining is very electrically intensive. Anti-EV zealots like to claim EV's are "coal powered". Funny how they never mention how much "coal power" it takes to refine all the gasoline for ICE vehicles. That's why oil refineries have their own power sub-stations.
All EV's have vampire drain and more EV's with vampire drain is a GOOD thing!
Honestly, if there were an actual reason for the vampire/phantom drain, I would be fine with it. But it is a complete waste and serves no purpose at all (as I posted elsewhere today, see below). My car burned something like 2kWh uploading a couple hundred MB of data (and most of that was burned to upload 2MB). It’s just sort of silly. Just make the car stay in sleep mode. It works perfectly fine in that mode. From sleep mode, I can be in the car and driving in seconds. Why go to idle mode?
I have driven 100 miles on my battery in my garage (this is not what I thought they meant by Autopilot!), and 900 on the road. I would prefer to not use my battery driving in my garage...for no reason. It’s 60 degrees in there!
I’m sure this will be fixed soon, it is just sort of silly. If it were cold, I would understand the drain.
I understand the way the drain works pretty well now and can quantify relative magnitudes of the various drains, but what I can’t easily control is forcing the car from idle mode to sleep mode.
Lost 51 miles of range in 53 hours?!
Idle Battery Drain
StealthP3D
Well-Known Member
Honestly, if there were an actual reason for the vampire/phantom drain, I would be fine with it. But it is a complete waste and serves no purpose at all (as I posted elsewhere today, see below). My car burned something like 2kWh uploading a couple hundred MB of data (and most of that was burned to upload 2MB). It’s just sort of silly. Just make the car stay in sleep mode. It works perfectly fine in that mode. From sleep mode, I can be in the car and driving in seconds. Why go to idle mode?
I have driven 100 miles on my battery in my garage, and 900 on the road. I would prefer to not use my battery driving in my garage...for no reason. It’s 60 degrees in there!
I’m sure this will be fixed soon, it is just sort of silly. If it were cold, I would understand the drain.
I understand the way the drain works pretty well now and can quantify relative magnitudes of the various drains, but what I can’t easily control is forcing the car from idle mode to sleep mode.
Lost 51 miles of range in 53 hours?!
Idle Battery Drain
Well, you have far more than typical battery drain. I've never used a third party app and have quite a bit less than 1% per day. I just park it (outside 80% of the time) and don't worry about it because it's less than having a small chest freezer. When I talk to other Tesla owners they relay the same thing. It's only online where a few really vocal people report these extreme losses. I don't know if they have a real issue or not but it doesn't affect me (or anyone I know) so it's hard for me to get too excited about it.
AlanSubie4Life
Efficiency Obsessed Member
I'll be out of town for two weeks and I'll leave it unplugged and try not to wake it up with the app, so we can get even more sleeping/idle power consumption.
It’s interesting @Jedi2155 posted some TeslaFi data in another thread, and his sleep mode average was actually very low single digit watts. I don’t know why @OverJohn is getting different average results but I may be misreading the data or perhaps there is some wide variation on sleep mode as well. But in any case it is quite low - I would be happy even with 12W. Below 10W would be a great start.
AlanSubie4Life
Efficiency Obsessed Member
Well, you have far more than typical battery drain. I've never used a third party app and have quite a bit less than 1% per day. I just park it (outside 80% of the time) and don't worry about it because it's less than having a small chest freezer. When I talk to other Tesla owners they relay the same thing. It's only online where a few really vocal people report these extreme losses. I don't know if they have a real issue or not but it doesn't affect me (or anyone I know) so it's hard for me to get too excited about it.
1% a day is 3 miles a day and that is what I see, and what I see is typical.
Until today, I was not using any 3rd party app (started using Stats today after posting all that data).
Based on the Tesla Stats app histogram, my phantom/vampire drain is fairly typical (I do quite often see just a mile a day when my car stays sleeping). I’m not making it up. Nor do I think it is anything more serious than a silly software problem.
I deliberately don’t own a small chest freezer!!!
")
And at least a small chest freezer provides some value!
jcal0820
ride the wave
On the last day of my 3 day trip, & just checked the status of my Model 3, parked at airport parking since Friday morning. Left it there w exactly 236 miles of range left; today, Sunday morning, it's down to 228 miles of range. It's outdoor parking lot with ambient avg temp of 60 - 70 degrees F. Seems a little more drain than my last trip.
My 2015 MS 70 is currently inside an auto custom shop....arrived with 125 miles 12/7....just checked app...loss of 31 miles over 10 days so.....3.1mile avg loss a day....not bad at all since they are opening and closing doors/trunks/ect and my app usage keeps it awake so I'm good with my loss so far....heard of much worse....
TPeople forget that oil refining is very electrically intensive. Anti-EV zealots like to claim EV's are "coal powered". Funny how they never mention how much "coal power" it takes to refine all the gasoline for ICE vehicles. That's why oil refineries have their own power sub-stations.
I had heard this too. I actually read (but have forgotten where) that it takes 7 kWh of electricity and something like 100 gallons of water to refine 1 gallon of gasoline from crude. This doesn't consider that cost getting the crude to the refinery of course. Do you have a reference? I'm in Texas visiting my in-laws for XMAS and I would love to tell them and them give them a reference to go and look it up for themselves. I'd love to tell them how many miles I can go on 7 kWh of energy without all the inefficiencies of making, transporting, and burning gasoline.
My sister-in-law was complaining about the mercury in CFLs and I told her that the coal power plant (that she is down wind of) was spewing thousands of CFLs worth of mercury into the air that her kids are breathing every day. If she wanted to bitch about Mercury, she should tell HL&P to stop burning coal.
Similar threads
- Question
- Replies
- 36
- Views
- 2K
- Replies
- 10
- Views
- 690
- Replies
- 14
- Views
- 906
- Replies
- 14
- Views
- 2K