I'm waiting for the combo RSV/Flu/CovidUniversalVariants/Monkey/Zombie booster.Get that last booster and keep the streak alive! Sooner you get it the sooner you can get a booster for the booster, lol.


Welcome to Tesla Motors Club
Discuss Tesla's Model S, Model 3, Model X, Model Y, Cybertruck, Roadster and More.
Register
Install the app
How to install the app on iOS
You can install our site as a web app on your iOS device by utilizing the Add to Home Screen feature in Safari. Please see this thread for more details on this.
Note: This feature may not be available in some browsers.
-
Want to remove ads? Register an account and login to see fewer ads, and become a Supporting Member to remove almost all ads.
You are using an out of date browser. It may not display this or other websites correctly.
You should upgrade or use an alternative browser.
You should upgrade or use an alternative browser.
Coronavirus
- Thread starter Wenche
- Start date

Daniel in SD
(supervised)
Get that last booster and keep the streak alive! Sooner you get it the sooner you can get a booster for the booster, lol.
Just a joke! My bivalent booster seems to be working great. Probably because I didn’t get an unnecessary second wild type booster.
Did you not click through? So many don’t click through anymore.Your misunderstanding is a reflection of your poor (or twisted) reading comprehension.
They've been caught lying so many times, but lets work the numbers.Good to know you're at least one year old.
“COVID-19 cases peaked from 25 August to 7 September, with the rate among fully vaccinated people at 49.5 per 100,000, while in unvaccinated people it was 561 per 100,000, a more than 10-fold difference,” Dr Chant said.


Your quote timeframe nails the peak inoculation rate, where the jabbed are considered unvaccinated for 14 days.
This is one of the major reasons why they were able to show efficacy where there was none, by cohort shifting. So now that they can't do that anymore lets see how this is holding up? They dont do infection numbers by vaccination status anymore because it was laughable, so we'll have to use hospitalisation.
Here's the hospitalisation numbers for Mc Chant's state of NSW for the last 6 months:
Already we can see that the hospitalisation numbers show a 8,490% increase in hospitalisation for the vaccinated after adjusting for relative population sizes, without which it is ~700:1. We can see a dose response curve and we can see an unvaccinated fraction that is so small you can't cohort it at all. In other words you can't pull a positive from this data in any way. You can only say that the data is bad, but it's the official data, forced out by a FOI.
If we assume that the vaccinated are protected 10 fold, how does the total infection count hit 40% of the total population or 3,750,000 infections, when an infection rate of 50/100k would give a total case count of 3,500? Even though we've hospitalised almost 450% of that number. Ms Chant is out by a factor of 1000 and full of it once again.
How good are numbers? They'll make a liar out of any politician.
Last edited:
AlanSubie4Life
Efficiency Obsessed Member
They've been caught lying so many times, but lets work the numbers.
Your quote timeframe nails the peak inoculation rate, where the jabbed are considered unvaccinated for 14 days.
View attachment 887299
This is one of the major reasons why they were able to show efficacy where there was none, by cohort shifting. So now that they can't do that anymore lets see how this is holding up? They dont do infection numbers by vaccination status anymore because it was laughable, so we'll have to use hospitalisation.
Here's the hospitalisation numbers for Mc Chant's state of NSW for the last 6 months:
View attachment 887295
Already we can see that the hospitalisation numbers show a 8,490% increase in hospitalisation for the vaccinated after adjusting for relative population sizes, without which it is ~700:1. We can see a dose response curve and we can see an unvaccinated fraction that is so small you can't cohort it at all. In other words you can't pull a positive from this data in any way. You can only say that the data is bad, but it's the official data, forced out by a FOI.
If we assume that the vaccinated are protected 10 fold, how does the total infection count hit 40% of the total population or 3,750,000 infections, when an infection rate of 50/100k would give a total case count of 3,500? Even though we've hospitalised almost 450% of that number. Ms Chant is out by a factor of 1000 and full of it once again.
How good are numbers? They'll make a liar out of any politician.
To me this data looks fine: you’d expect heavily vaccinated people to be a LOT more likely to be hospitalized. That’s normal and does not indicate a lack of efficacy (I would guess vaccination reduces hospitalization risk by about 5x-10x, ballpark, and these data are not necessarily inconsistent with that).
Perhaps you could link your original sources though so it is easier to parse the data.
~700 to 1? A good result?To me this data looks fine: you’d expect heavily vaccinated people to be a LOT more likely to be hospitalized. That’s normal and does not indicate a lack of efficacy (I would guess vaccination reduces hospitalization risk by about 5x-10x, ballpark, and these data are not necessarily inconsistent with that).
Perhaps you could link your original sources though so it is easier to parse the data.
or adjusted for 14.5% vaccination rate 84.9 to 1? That means that an individual who gets vaccinated in NSW increases their changes of hospitalisation by 84.9 times
That number should be a fraction if there was any efficacy. If we use the numbers from the Lancet, it's a thousand times more than it should be.
When do you reckon we should start to see things that we know are correct having an effect in the population? I would have thought by now we'd be able to see this protection?
source below, have a poke around, the age data is enlightening, it destroys cohorting.

Last edited:
andy.connor.e
Member
Are you LCHF_Matt (the guy? who created that PowerBI)? Just wondering.~700 to 1? A good result?
or adjusted for 14.5% vaccination rate 84.9 to 1? That means that an individual who gets vaccinated in NSW increases their changes of hospitalisation by 84.9 times
That number should be a fraction if there was any efficacy. If we use the numbers from the Lancet, it's a thousand times more than it should be.
When do you reckon we should start to see things that we know are correct having an effect in the population? I would have thought by now we'd be able to see this protection?
source below, have a poke around, the age data is enlightening, it destroys cohorting.
Since an amazing 97.3% of Australians over 16 have had at least one dose of vaccine (wow!), it is remarkable that they found any unvaccinated people to enter into the report. I wonder how the unvaccinated fit into the following categories.
(from the PowerBI linked)
Doggydogworld
Active Member
Your PowerBI shows 34 cases out of 1,182,309 people with no dose. But there are only 8.1m people in NSW, and 97% above age 16 have had at least one dose. These numbers don't add up, unless the no dose cohort is practically all children. Which would wildly skew the data.~700 to 1? A good result?
or adjusted for 14.5% vaccination rate 84.9 to 1? That means that an individual who gets vaccinated in NSW increases their changes of hospitalisation by 84.9 times
That number should be a fraction if there was any efficacy. If we use the numbers from the Lancet, it's a thousand times more than it should be.
When do you reckon we should start to see things that we know are correct having an effect in the population? I would have thought by now we'd be able to see this protection?
source below, have a poke around, the age data is enlightening, it destroys cohorting.
What % of the age 70+ population have zero doses?
no.Are you LCHF_Matt (the guy? who created that PowerBI)? Just wondering.
Since an amazing 97.3% of Australians over 16 have had at least one dose of vaccine (wow!), it is remarkable that they found any unvaccinated people to enter into the report. I wonder how the unvaccinated fit into the following categories.
View attachment 887346
(from the PowerBI linked)
keep looking.
No, what?no.
keep looking.
The data I found in the PowerBI (and as indicated by the author) suggests we could be comparing healthy kids with decrepit 90 year old demented vascular victims.
Bring me something else and I will be happy to look at it for you.
Still no benefit, doesn't matter how you slice and dice:Your PowerBI shows 34 cases out of 1,182,309 people with no dose. But there are only 8.1m people in NSW, and 97% above age 16 have had at least one dose. These numbers don't add up, unless the no dose cohort is practically all children. Which would wildly skew the data.
What % of the age 70+ population have zero doses?
No I'm not matt.No, what?
The data I found in the PowerBI (and as indicated by the author) suggests we could be comparing healthy kids with decrepit 90 year old demented vascular victims.
Bring me something else and I will be happy to look at it for you.
See the graph above.
Read the screen snip I posted above. Matt says the information for stratification analysis isn't there. If he says it isn't, then the thing you think you see isn't what you think it is.No I'm not matt.
See the graph above.
Yes, so he allocated them all to each age group. Very sneaky. Still no benefit when 10x, nor any benefit per age group. ALL negative. all the time.Read the screen snip I posted above. Matt says the information for stratification analysis isn't there. If he says it isn't, then the thing you think you see isn't what you think it is.
Doesn't matter, my friend. They are not risk stratified and compared. Matt says so. Are you calling him a liar? Bring us vaccinated 90 year old vasculopaths with 4 vaccinations vs unvaccinated 90 year old vasculopaths. In statistically significant numbers. Then we can talk.Yes, so he allocated them all to each age group. Very sneaky. Still no benefit when 10x, nor any benefit per age group. ALL negative. all the time.
Last edited:
Put down the crack pipe.Doesn't matter, my friend. They are not risk stratified and compared. Matt says so. Are you calling him a liar? Bring us vaccinated 90 year old vasculopaths with 4 vaccinations vs unvaccinated 90 year old vasculopaths. In statistically significant numbers. Then we can talk.
This is the real world with 8million people, of those only 22 were hospitalised without a vaccine.
Your risk of being hospitalised was increased with vaccination over the last six months to the tune of 8,490%. The lancet said there was supposed to be protection to the tune of 92%:
The actuals were 105,750% different to that.
That is not a good outcome.
Why is that all the things that work, don't work in the real world?
Another way of looking at it is that the 15,110 were protected to the tune of 92% according to the lancet. This would mean that without the protection there would have been 188,875 hospitalisations in the vaccinated. Which is a hell of a lot higher than the 22, who would then represent 0.000011% of the hospitalisations.
You can spin it any way you like, doesn't matter, it doesn't work, certainly not in NSW. It only works if it works in the real world.
It's poison.
You can spin it any way you like, doesn't matter, it doesn't work, certainly not in NSW. It only works if it works in the real world.
It's poison.
What if it's not just hospitalisations that are dose dependent, it's infections too:

"The association of increased risk of COVID-19 with higher numbers of prior vaccine doses in our study, was unexpected. A simplistic explanation might be that those who received more doses were more likely to be individuals at higher risk of COVID-19. A small proportion of individuals may have fit this description."
Love it how this has nothing to do with the unvaccinated who still have no explanation of their apparent superpowers. But they go on:
However, the majority of subjects in this study were generally young individuals and all were eligible to have received at least 3 doses of vaccine by the study start date, and which they had every opportunity to do. Therefore, those who received fewer than 3 doses (>45% of individuals in the study) were not those ineligible to receive the vaccine, but those who chose not to follow the CDC’s recommendations on remaining updated with COVID-19 vaccination, and one could reasonably expect these individuals to have been more likely to have exhibited higher risk-taking behavior. Despite this, their risk of acquiring COVID-19 was lower than those who received a larger number of prior vaccine doses. This is not the only study to find a possible association with more prior vaccine doses and higher risk of COVID-19. A large study found that those who had an Omicron variant infection after previously receiving three doses of vaccine had a higher risk of reinfection than those who had an Omicron variant infection after previously receiving two doses of vaccine [21]. Another study found that receipt of two or three doses of a mRNA vaccine following prior COVID-19 was associated with a higher risk of reinfection than receipt of a single dose [7]. We still have a lot to learn about protection from COVID-19 vaccination, and in addition to a vaccine’s effectiveness it is important to examine whether multiple vaccine doses given over time may not be having the beneficial effect that is generally assumed.
Love it how they assume about our health.
@juk , look.
I'll be the first to say that vaccinating with single target spike protein vaccines for mRNA viruses which are constantly mutating may not be the best long-term solution to the situation, because you can never keep up with the mutations.
When I see those graphs from the non-peer reviewed preprint article (you might link those for us when you quote them) you posted,

 www.medrxiv.org
[It is a Cleveland Clinic study of generally healthy individuals who were employees, some of whom were working in high-risk environments, average age of 42. It is not a study of the general population and excludes many of the highest risk groups.]
Here is what the authors conclude, despite the confounding findings in the graph you posted:
Here is what I think: the people who are most likely to vaccinate are those who are or who perceive themselves to be at higher risk. This is not only underlying conditions but also higher risk environments. Not all, but many. Therefore, there is a self-selection process going on that may skew the data to what you are seeing.
This same self-selection could be affecting the hospitalization data you brought us above with your incredibly high relative risk numbers.
In addition, it is important to remember that at this time, we are counting the people hospitalized with covid the same as people hospitalized for covid. That number is not insignificant.
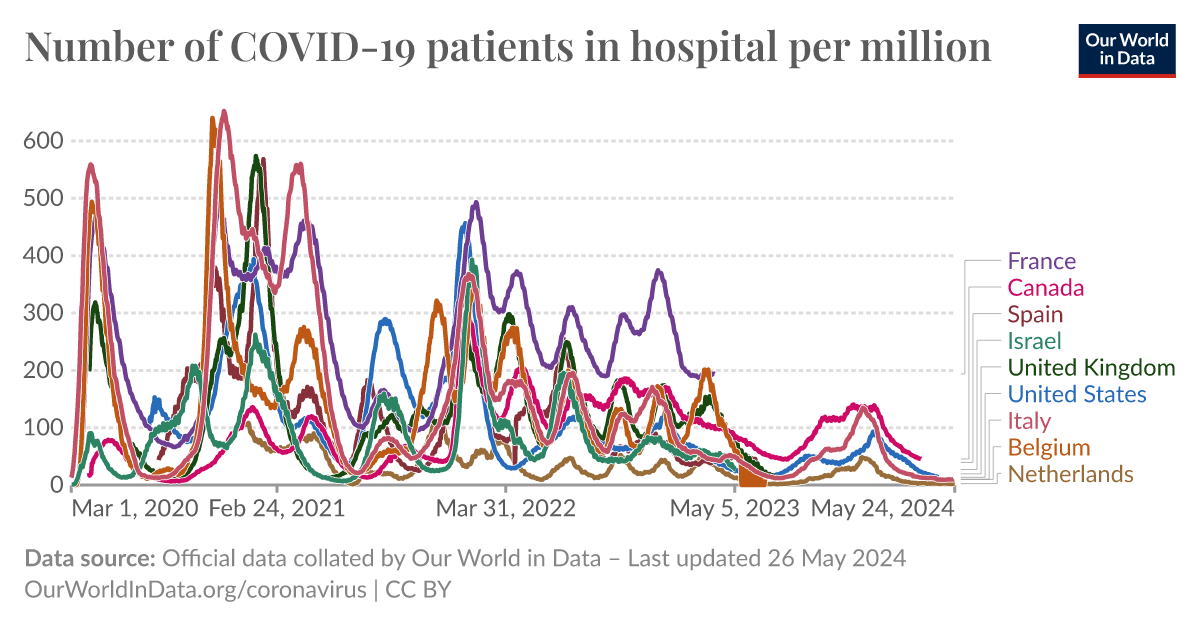
Furthermore, hospitalizations for Covid are RARE. Here is a comparative graph for hospitalizations per million showing the variations. With the exception of France, it is in the range of 100 per million during peaks, and much lower much of the rest of the time.
 ourworldindata.org

Given the low numbers, possibly cut in half by coincident infection, it is hard to draw conclusions about causation from vaccination. People who are at higher risk for covid are also at higher risk for other conditions that might hospitalize them (older, diabetic, obese, arthritic, etc).
I want to see a prospective paper that studies matched patients who are of comparable risk in terms of underlying conditions and age, and that excludes prior infection (which is a confounding variable and may be hard to determine) then compares vaccinated to nonvaccinated for subsequent covid infection and hospitalization due to Covid. Then I might entertain your idea that vaccination causes disease. Not saying it couldn't be a thing, but your examples don't show that. There are other explanations.
I'll be the first to say that vaccinating with single target spike protein vaccines for mRNA viruses which are constantly mutating may not be the best long-term solution to the situation, because you can never keep up with the mutations.
When I see those graphs from the non-peer reviewed preprint article (you might link those for us when you quote them) you posted,
Effectiveness of the Coronavirus Disease 2019 (COVID-19) Bivalent Vaccine
Background The purpose of this study was to evaluate whether a bivalent COVID-19 vaccine protects against COVID-19. Methods Employees of Cleveland Clinic in employment on the day the bivalent COVID-19 vaccine first became available to employees, were included. The cumulative incidence of...
www.medrxiv.org
[It is a Cleveland Clinic study of generally healthy individuals who were employees, some of whom were working in high-risk environments, average age of 42. It is not a study of the general population and excludes many of the highest risk groups.]
Here is what the authors conclude, despite the confounding findings in the graph you posted:
Among 51011 working-aged Cleveland Clinic employees, the bivalent COVID-19 vaccine booster was 30% effective in preventing infection, during the time when the virus strains dominant in the community were represented in the vaccine.
Here is what I think: the people who are most likely to vaccinate are those who are or who perceive themselves to be at higher risk. This is not only underlying conditions but also higher risk environments. Not all, but many. Therefore, there is a self-selection process going on that may skew the data to what you are seeing.
This same self-selection could be affecting the hospitalization data you brought us above with your incredibly high relative risk numbers.
In addition, it is important to remember that at this time, we are counting the people hospitalized with covid the same as people hospitalized for covid. That number is not insignificant.
Furthermore, hospitalizations for Covid are RARE. Here is a comparative graph for hospitalizations per million showing the variations. With the exception of France, it is in the range of 100 per million during peaks, and much lower much of the rest of the time.
Number of COVID-19 patients in hospital per million
An interactive visualization from Our World in Data.
Given the low numbers, possibly cut in half by coincident infection, it is hard to draw conclusions about causation from vaccination. People who are at higher risk for covid are also at higher risk for other conditions that might hospitalize them (older, diabetic, obese, arthritic, etc).
I want to see a prospective paper that studies matched patients who are of comparable risk in terms of underlying conditions and age, and that excludes prior infection (which is a confounding variable and may be hard to determine) then compares vaccinated to nonvaccinated for subsequent covid infection and hospitalization due to Covid. Then I might entertain your idea that vaccination causes disease. Not saying it couldn't be a thing, but your examples don't show that. There are other explanations.
Last edited:
Similar threads
- Replies
- 84
- Views
- 5K
- Replies
- 2
- Views
- 1K
- Replies
- 165
- Views
- 25K
- Replies
- 85
- Views
- 9K
- Replies
- 23
- Views
- 5K
B