Welcome to Tesla Motors Club
Discuss Tesla's Model S, Model 3, Model X, Model Y, Cybertruck, Roadster and More.
Register

Coronavirus

This site may earn commission on affiliate links.
Wow. Graph of airline traffic. They are parking US jets in the desert for storage. You are seeing $525 million dollars a day getting destroyed in the US alone.


View attachment 534660
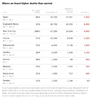
If you think that graph is "wow", it doesn't even tell the whole story. Not only is available capacity ("flight volume") down, but so is load factor. The true bottom line is pax count, RPMs and revenue are down ~97%!

United Airlines is forecasting to fly fewer passengers the entire month of May 2020 than they did any one day of May 2019.

That's the full story of how the airline business has been wrecked.

The COVID money U.S. carriers receive is conditional on them not furloughing or reducing salaries prior to September 30th. They will be paying a lot of folks to do nothing until then. October 1st will be a bloody massacre but at least the people affected have some time to prepare for it.
 
About that Santa Clara county study about prevalence using the antibody tests.

Trevor Bedford on Twitter

Using equation from the appendix we can see how the estimate of prevalence varies with test specificity. A specificity of 99.5% converts an observed 1.5% positive to an estimated prevalence of 1.3%. 4/8

However, if we assume that the test is just slightly worse and has specificity of 98.5%, then, with observed 1.5% positivity, we'd estimate a prevalence of 0%. 5/8

Given how sensitive these results are to performance of the assay, I don't think it's safe to conclude that infections are "50-85-fold more than the number of confirmed cases". 7/8
This is the reason, at low prevalence, specificity is so important - and the study is getting trashed.

Here is one more useful thread on it.

Natalie E. Dean, PhD on Twitter

So, the major reasons why I remain skeptical:
- Unstable population weighting
- Wide bounds after adjusting for clustering
- Is test specificity really that high?
- Unavoidable potential for consent bias
- Is this consistent with other emerging serosurvey data? Fin 10/10
Ok, so what's wrong with the confidence intervals in this preprint? Well they publish a confidence interval on the specificity of the test that runs between 98.3% and 99.9%, but only 1.5% of all the tests came back positive! 1/

That means that if the true specificity of the test lies somewhere close to 98.3%, nearly all of the positive results can be explained away as false positives (and we know next to nothing about the true prevalence of COVID-19 in Santa Clara County) 2/

They report a 95% confidence interval for the prevalence of COVID-19 in Santa Clara County that runs from 2.01% to 3.49% though! That seems oddly narrow, given that they have already shown that it is within the realm of possibility that the data collected are all false positives!

Marc Lipsitch suggests some ways to make the study better by disclosing more information.

Marc Lipsitch on Twitter

I hear an Echo...

;)
Seriously, good to reiterate as this thread is very long and relatively low density.
 
About that Santa Clara county study about prevalence using the antibody tests.

Trevor Bedford on Twitter

Using equation from the appendix we can see how the estimate of prevalence varies with test specificity. A specificity of 99.5% converts an observed 1.5% positive to an estimated prevalence of 1.3%. 4/8

However, if we assume that the test is just slightly worse and has specificity of 98.5%, then, with observed 1.5% positivity, we'd estimate a prevalence of 0%. 5/8

Given how sensitive these results are to performance of the assay, I don't think it's safe to conclude that infections are "50-85-fold more than the number of confirmed cases". 7/8
This is the reason, at low prevalence, specificity is so important - and the study is getting trashed.

Here is one more useful thread on it.

Natalie E. Dean, PhD on Twitter

So, the major reasons why I remain skeptical:
- Unstable population weighting
- Wide bounds after adjusting for clustering
- Is test specificity really that high?
- Unavoidable potential for consent bias
- Is this consistent with other emerging serosurvey data? Fin 10/10
Ok, so what's wrong with the confidence intervals in this preprint? Well they publish a confidence interval on the specificity of the test that runs between 98.3% and 99.9%, but only 1.5% of all the tests came back positive! 1/

That means that if the true specificity of the test lies somewhere close to 98.3%, nearly all of the positive results can be explained away as false positives (and we know next to nothing about the true prevalence of COVID-19 in Santa Clara County) 2/

They report a 95% confidence interval for the prevalence of COVID-19 in Santa Clara County that runs from 2.01% to 3.49% though! That seems oddly narrow, given that they have already shown that it is within the realm of possibility that the data collected are all false positives!

Marc Lipsitch suggests some ways to make the study better by disclosing more information.

Marc Lipsitch on Twitter

A caveat with the Chelsea numbers: They sampled people on the street, meaning those who didn't stay at home. They are obviously more prone to exposure.
 
  • Informative
Reactions: EVNow and AZRI11
I see no peaking at this time. We just have "wavy" data - mostly because of uneven reporting over the weekend. The daily cases aren't going down (and they are not going up because the tests have hit an upper limit), so why would fatalities ?
Yeah, the peak is obscured by weekly noise. The growth rate is definitely lower than it was a week or two ago. It's the decline in growth rate that determines the peak in daily deaths. So we'll keep our eyes on the growth rates. If they stay constant or increase, then we could be in for a second wave.
 
I just invented a mask that doesn't require a filter and lasts forever:

It covers nose and mouth with piece made of plastic or other impenetrable material, and has two valves, splitting intake and exhaust.
The exhaust goes into a vertical pipe downwards down to the belt, ensuring that virus from the out breath doesn't fly very far.
The intake goes into a vertical pipe upwards, taking air from 7.5 feet above ground (or so) where the virus should be rarer. Especially if others are using a similar mask. Unfortunately a bit cumbersome.
 
The NYTimes had this opinion piece written by Dr. Richard Levitan, an emergency room doctor for over 30 years who teaches intubation, who volunteered to work for 10 days at NYC’s Bellevue Hospital again assisting in the ICU. He recounts what that time was like and what he observed from the experience about early warning oxygen levels in COVID19 pneumonia patients and why many of those sent home without hospitalization suffered sudden deadly breathing problems. (from AppleNews link).
Opinion | The Infection That’s Silently Killing Coronavirus Patients — The New York Times

“We are just beginning to recognize that Covid pneumonia initially causes a form of oxygen deprivation we call “silent hypoxia” — “silent” because of its insidious, hard-to-detect nature.

....But when Covid pneumonia first strikes, patients don’t feel short of breath, even as their oxygen levels fall. And by the time they do, they have alarmingly low oxygen levels and moderate-to-severe pneumonia (as seen on chest X-rays)....

To my amazement, most patients I saw said they had been sick for a week or so with fever, cough, upset stomach and fatigue, but they only became short of breath the day they came to the hospital. Their pneumonia had clearly been going on for days, but by the time they felt they had to go to the hospital, they were often already in critical condition.”

Found it to be a very enlightening article and cautionary for anyone homebound with CV19 symptoms.
 
Last edited by a moderator:
Also, the weird IHME model has been updated and now (extremely optimistically) predicts as a best guess 66k deaths (oddly, bracketed by 45k (I can guarantee you we're not stopping there!) and 145k).

Seems to me it's more likely to end up in the 70-80k range - assuming things go well.

Considering that there seems to be a general tendency to ease up on mitigation, I think that is very optimistic.
 
  • Like
Reactions: Doggydogworld
upload_2020-4-22_9-45-19.jpeg

25,000 Missing Deaths: Tracking the True Toll of the Coronavirus Crisis
 

Attachments

  • upload_2020-4-22_9-45-19.png
    upload_2020-4-22_9-45-19.png
    367.4 KB · Views: 34
Considering that there seems to be a general tendency to ease up on mitigation, I think that is very optimistic.

Yeah, I'm assuming not even a hint of a second wave or bump at the end. We can't have different states doing different things. As a wise woman said:

"Having some states lock down and some states not lock down is like having a peeing section in the swimming pool."
— Daphne Mosher


Anyway, I didn't realize that Ioannidis had weighed in on this and says all is well now. It's ironic that he's best known for a paper describing all scientific studies as utter crap. I honestly don't know how he does this video with a straight face.

Why Most Published Research Findings Are False - Wikipedia


In any case, that means we can all go back to work now. /thread
 
Last edited:
The NYTimes had this opinion piece written by Dr. Richard Levitan, an emergency room doctor for over 30 years who teaches intubation, who volunteered to work for 10 days at NYC’s Bellevue Hospital again assisting in the ICU. He recounts what that time was like and what he observed from the experience about early warning oxygen levels in COVID19 pneumonia patients and why many of those sent home without hospitalization suffered sudden deadly breathing problems. (from AppleNews link).

Opinion | The Infection That’s Silently Killing Coronavirus Patients — The New York Times

“We are just beginning to recognize that Covid pneumonia initially causes a form of oxygen deprivation we call “silent hypoxia” — “silent” because of its insidious, hard-to-detect nature.

....But when Covid pneumonia first strikes, patients don’t feel short of breath, even as their oxygen levels fall. And by the time they do, they have alarmingly low oxygen levels and moderate-to-severe pneumonia (as seen on chest X-rays)....

To my amazement, most patients I saw said they had been sick for a week or so with fever, cough, upset stomach and fatigue, but they only became short of breath the day they came to the hospital. Their pneumonia had clearly been going on for days, but by the time they felt they had to go to the hospital, they were often already in critical condition.”

Found it to be a very enlightening article and cautionary for anyone homebound with CV19 symptoms.
 

Weird reply here, sorry.

Read this and got a Pulse Oximeter. He comes at it from a respiratory approach and there is likely more going on but it is good info as I see it. It also fits with the question about the asymtomatic people and what that might mean. Good stuff.
 
  • Like
Reactions: SMAlset
Youtube has a full film “Planet of the Humans”. Watched it related to Earthday and Michael Moore being involved. Yuck. Dark and cynical and stretching to avoid any glimmers of hopefulness. Trashed any hopefulness for renewable energy or sustainability, really trashed ANY effort that bothers to make anything even a little better ... all Presented as liars. Little offered other than shivering in the dark on a pile of capitalist bodies YMMV.
 
@bkp_duke , no need to sugar-coat it, why don't you just come out and speak your mind?

In all seriousness, I'm waiting for the robust randomized studies to come out on HCQ. We should see something within the next 10 days. Rather than each of us pointing at the other guy's crappy study and saying "it's worse than the one that supports my position", I suggest we both hang loose and wait for scientifically-valid studies to be presented.

That's what you should have done in the first place. (not bkp_duke, you)
 
Last edited:
The effort to extrapolate findings from one location where you happen to have data because it is easier to develop, without controlling for known and unknown variables, is a classic analytical error known as the "streetlight effect," named after the famous joke:

The fundamental error here is summed up in an old joke scientists love to tell. Late at night, a police officer finds a drunk man crawling around on his hands and knees under a streetlight. The drunk man tells the officer he’s looking for his wallet. When the officer asks if he’s sure this is where he dropped the wallet, the man replies that he thinks he more likely dropped it across the street. Then why are you looking over here? the befuddled officer asks. Because the light’s better here, explains the drunk man ....

Examples of how the streetlight effect sends studies off track are ubiquitous. In many cases it is painfully obvious that scientists are stuck with surrogate measures in place of what they really want to quantify.

https://www.sjsu.edu/people/fred.prochaska/courses/ScWk240/s3/Freedman-Week-15.pdf

Discarding studies that directly measure the level of infections in a location in favor of extrapolating from another location like NYC, without controlling for known and unknown variables, is a flawed analysis that will very likely lead to conclusions that will be proven wrong as more data is collected.

This is particularly true since we already have strong evidence that fatality rates vary widely from city to city and region to region across Europe and Asia. There is every reason to believe the same will be true in the U.S. and other parts of the world.
 
Last edited:
  • Informative
Reactions: Dig deeper
While none of the things that Georgia is doing should be reopened at this point, I do think and hope that states' public health departments are looking at the data and analyzing where new cases are actually coming from. I would like a data-driven approach to what actually can be re-opened, and what is too risky with significant numbers of cases in the community.

For example:

1) Are grocery stores safe? I have no idea. I'd like to know how many people have picked up their disease from the grocery store via community transmission, and how it happened. I'd like to know whether masks were in use, etc.

2) What about parks? Can they be opened with distancing? It seems like they probably could be and it would probably be for the best. I'd prefer to have the restrooms left closed. I'm a bit concerned in San Diego, because they are opening up some parks, but it looks like they are opening up the restrooms as well! Is this data driven? They are leaving the parking lots and other amenities closed, however.

Anyway, it would be good to get education on what is actually dangerous and what isn't. I bet people could handle it.

While the decision in Florida to open the beaches seemed silly on its face, I saw a couple pictures (I did not watch video or look extensively) purporting to show lack of social distancing, but it seemed fine to me. It looked like family groups together, and most people were apart. It seems to me that opening beaches could be ok, with restrictions. It seems like a fairly safe environment. But again, would be nice to be data driven. If we actually get proximity contact tracing going, it could really help inform these decisions and identify what is actually risky and what is minimal risk.

I can't imagine that public bathrooms are safe, though.

The best place for catching COVID is clearly in a packed, indoor religious gathering lasting several hours: all the singing & praising at full tilt most effectively aerosolises whatever's in a sinner's lungs and the generally low rate of air exchange ensures everyone partakes in a maximum "blessing" from the cloud. The obligatory glad-handing with pastor on the way out only seals the deal!
https://www.miamiherald.com/news/coronavirus/article241987921.html
 
Coronavirus (COVID-19) health alert

Woohoo, recovered jumped from about 63% to 71%

It looks like that in Oz, new case growth have been less than 1% for tha past 10 days, and this with a lot of testing.

Recovered percentage is a garbage number.

Number of cases is mostly garbage because it's dependent on the testing appartus
Recovered number is a function of doctors following up on those cases

So you're multiplying a garbagey number times a garbagey number to get garbage squared.