May numbers.
One thing I've noticed is that because of rounding errors in the reported wh/m numbers, there can be slight inaccuracies in my calculation of the monthly wh/m numbers for people who don't report these number separately.
For the monthly plots, I calculate wh/m_monthly = (tot_energy_to_date - tot_energy_as_of_last_update)/((tot_miles_to_date - tot_miles_as_of_last_update) where
tot_energy_to_date = avg_whm_to_date * miles_to_date, etc. This formula is exact, but slight errors creep in because avg_whm_to_date is
rounded. This can cause problems when the number of miles driven in the last month is much less than the total miles driven. For example, if you've
driven 20k miles, and the average wh/m is 330 and then in the next month you only drive 100 miles, say with wh/m of 300, then because of rounding, the car will still probably say your average wh/m is 330 even though it is now slightly less than that. Over time this should wash out, but any given month could be off a bit.
I'll try to be more careful about keeping track of monthly numbers for anyone who reports monthly numbers separately. (I do this already in many cases but haven't been totally systematic about it).
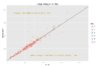
On the total whs coming out of the wall vs whs reported by the car question, phx182flyer keeps track of his whs from the wall on a daily basis. He's got a nice regression of wh_wall vs miles here:
Graphs: ElecPwr
He is basically seeing 365wh_wall/mile + 2 wh/day. This compares to his car which reports around 303 wh/m. I'd interpret this as charging losses of about 20%, plus 2wh vampire. This is in the same ball park as what mknox is seeing and Cottonwood's calculation.


")