Welcome to Tesla Motors Club
Discuss Tesla's Model S, Model 3, Model X, Model Y, Cybertruck, Roadster and More.
Register

Range Loss Over Time, What Can Be Expected, Efficiency, How to Maintain Battery Health

This site may earn commission on affiliate links.
How come when I charge my car at home using the basic 110V charger it chooses to lower the draw from the max 12 A to 9 A? I was only getting 3 mi/h of charge and it was drawing 9 A. I cranked it back to 12 A. Still, I don't get why it went down to 9 A on it's own.
Its detecting that the voltage is dropping as current goes up, and it's exceeding some parameter. Possible causes include: a mediocre connection on a daisy-chained outlet string leading to the outlet, too small (probably 14 gauge) wire going to the outlet, or a very long run from the power-panel to the outlet.

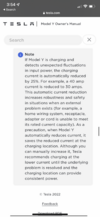
Check what voltage the car is reporting when it initially gets connected(0 amps, should be around 120V) vs when its ramped up the current to the max(12A, should ideally be no more than 3% less than the initial number). At some loss-level, probably at least a bit above 3%, the car will decide it should try NOT to burn down your house. Keep in mind that the 120V is allowed to waver a good bit(5%, up to 10% for short periods), and if some large load(AC) in your home starts drawing a ton of power, the voltage even for the 120V charger circuit will drop somewhat. The car will potentially notice this and decrease its own charging accordingly.
 
Last edited:
How come when I charge my car at home using the basic 110V charger it chooses to lower the draw from the max 12 A to 9 A? I was only getting 3 mi/h of charge and it was drawing 9 A. I cranked it back to 12 A. Still, I don't get why it went down to 9 A on it's own.
(If I’m not remember wrong):
-The charging system has a feature thet can detect voltage drops, which is a sign of that the current is higher than it really can deliver. So if the system detects an issue it can reduce the cargong power until the voltage stabilize.

[Edit]Beaten by @Sophias_dad :)
 
Fair comment. Is that because you are close(r) to the optimum torque in those speed ranges?

Its a matter of traction and rear wheels spinning up to 60mph/100kph. Third gear can be adjusted to not slip by adjusting turbo boost. Full engine power can only ve used above 100kph/60mph asopposed to the M3P that start weakening after about 80kph.

On a related topic, I've found a GSheets table showing the acceleration for the M3 SR3+, AWD and P 2019 versions - interesting to see the differences with the P3 clearly first to100 kph. I guess that the power drop off might be the same for all three above 100 kph but when superposing the curves by eye, the P and AWD seem closer at that point?

Heres a graph over M3P, LR and LR with boost:
2021 Model 3 Performance vs Long Range (rolling)
 
  • Like
Reactions: Steve446
@AAKEE - So If i charge my car daily and always keep it at 40-50% would be a great way to lower my percentage of battery degradation? I started driving more now as before i was mostly WFH... So i may loose 5-15% of battery during the day. I use the instant torque a lot. but started using autopilot as well... Thoughts?

Here is my battery percentage so far...
 

Attachments

  • D1C38DE1-FBFC-4A47-B99E-8BDF505937C2.jpeg
    D1C38DE1-FBFC-4A47-B99E-8BDF505937C2.jpeg
    121.3 KB · Views: 81
How come when I charge my car at home using the basic 110V charger it chooses to lower the draw from the max 12 A to 9 A? I was only getting 3 mi/h of charge and it was drawing 9 A. I cranked it back to 12 A. Still, I don't get why it went down to 9 A on it's own.
Did you check the fuse box to see what the circuit breaker is rated for? What else is plugged in on that same circuit breaker? Additionally there is a note in the manual talking about protection from irregularities.
 

Attachments

  • 97302D83-22EF-45E8-8934-EE45BD55CA37.png
    97302D83-22EF-45E8-8934-EE45BD55CA37.png
    497.3 KB · Views: 49
I've had my car for almost 1 year now. I've put on 20,000KM (12,000 miles), and my max range went from 567km to 560km. Barely any degradation so far.
I think your data is not unusual, but, to be pragmatic be aware that the real degradation might be different (a little bit more or less) than that shown by the Max Rated Range parameter. Tesla batteries and technologies vary as does the user's driving and charging habits and ambient storage temperatures. If you're happy just to see that then that's fine:cool: If you want to see more about expected degradation then read more of this thread's many pages, see also this data from Tesla logger as an example: Degradation
 
I think your data is not unusual, but, to be pragmatic be aware that the real degradation might be different (a little bit more or less) than that shown by the Max Rated Range parameter. Tesla batteries and technologies vary as does the user's driving and charging habits and ambient storage temperatures. If you're happy just to see that then that's fine:cool: If you want to see more about expected degradation then read more of this thread's many pages, see also this data from Tesla logger as an example: Degradation
That link is very impressive (and reassuring) losing only 10% (50km) at 180,000 km 👍😀
 
I've had my car for almost 1 year now. I've put on 20,000KM (12,000 miles), and my max range went from 567km to 560km. Barely any degradation so far.
How is your charging schedule?
(I would guess that you charge to a lower SOC then most other, which is good btw)

Degradation isnt really affected so much from the miles. Time x SOC x Temperatur cause more degradation.

Sometimes the selected SOC etc can fool the BMS a little like it do (did?) for me.

I have had full range for almost 1.5 year at every 100% charge until two days ago.
I use 55% as daily charge. My charging scedule havent caused the on screen range to drop at all, but IRL the battery has degraded. Probably much less degradation then the average.

I had 500km range at 100% SOC, the day before yesterday from 507km new-range so quite low degradation after 1.5year and 41.000km.
 
  • Like
Reactions: STS-134
If you want to see more about expected degradation then read more of this thread's many pages, see also this data from Tesla logger as an example: Degradation
While thats true and teslalogger and teslafy can show what to expect of the average car ised in the average way, we can affect the degradation by using a charging schedule that reduces the degradation.

Below is my (hand painted) range in the M3P 2021 teslalogger graph. I ise teslalogger since september. I do not know why my data isnt presented in the teslalogger graph.

I probably would have had 507km if I had not taken some action to set my range on track( = lowering). Its possible though that my NFP stays lower so I will start seeing a reduction in range.

My real degradation should be around 3% by now according to my own calculations, this should put my NFP slighly abowe 79kWh and the range slightly below 500km(499 or so).
The real graph should be a slope from 507 to ca 499km at present miles.

5F56A846-ADE8-4EEE-9192-B746A8225E26.jpeg
 
  • Like
Reactions: Steve446
@AAKEE - So If i charge my car daily and always keep it at 40-50% would be a great way to lower my percentage of battery degradation?
Yes. The lower the SOC is, the lower the degradation. If you charge daily, you could set the schedule to have the charge finished shortly before your first drive for the day, this will lower the average SOC and keep the degradation low.
I started driving more now as before i was mostly WFH... So i may loose 5-15% of battery during the day. I use the instant torque a lot. but started using autopilot as well... Thoughts?
No problem using the power for short bursts. Below 20% SOC, perhaps it is a good idea to not use too much power too often( its slower anyway so).

I like power and to hard acceleration and have still not almost any range after 41.000km.

If yo start testing the top speed often and do a lot of acceleration to 200kph or more it could cause some more degradation but shorts bursts probably do not wear much at all.
 
While thats true and teslalogger and teslafy can show what to expect of the average car ised in the average way, we can affect the degradation by using a charging schedule that reduces the degradation.

Below is my (hand painted) range in the M3P 2021 teslalogger graph. I ise teslalogger since september. I do not know why my data isnt presented in the teslalogger graph.

I probably would have had 507km if I had not taken some action to set my range on track( = lowering). Its possible though that my NFP stays lower so I will start seeing a reduction in range.

My real degradation should be around 3% by now according to my own calculations, this should put my NFP slighly abowe 79kWh and the range slightly below 500km(499 or so).
The real graph should be a slope from 507 to ca 499km at present miles.

View attachment 805433
True to say. Which entry did you use. M3 LR P I suppose? There's several different model designations. I can find samples representative of my degradation curve but they're not on the main blue line for M3 LR FL. Silly question but FL? I believe the data would be better with NFP but most people don't have SMT I guess. One other thing, if we're looking at calendar aging then shouldn't the graph X-axis be by months/years since the dawn of time (delivery, but really, assembly in the factory). This graph ignores the fact that different users have different use profiles ie one M3 might do 20 K Km much sooner than another... Maybe that's one reason for the noise you see on this graph.
 
True to say. Which entry did you use. M3 LR P I suppose? There's several different model designations. I can find samples representative of my degradation curve but they're not on the main blue line for M3 LR FL. Silly question but FL? I believe the data would be better with NFP but most people don't have SMT I guess. One other thing, if we're looking at calendar aging then shouldn't the graph X-axis be by months/years since the dawn of time (delivery, but really, assembly in the factory). This graph ignores the fact that different users have different use profiles ie one M3 might do 20 K Km much sooner than another... Maybe that's one reason for the noise you see on this graph.
What does FL stand for?
 
True to say. Which entry did you use. M3 LR P I suppose? There's several different model designations. I can find samples representative of my degradation curve but they're not on the main blue line for M3 LR FL. Silly question but FL? I believe the data would be better with NFP but most people don't have SMT I guess. One other thing, if we're looking at calendar aging then shouldn't the graph X-axis be by months/years since the dawn of time (delivery, but really, assembly in the factory). This graph ignores the fact that different users have different use profiles ie one M3 might do 20 K Km much sooner than another... Maybe that's one reason for the noise you see on this graph.
Teslalogger use SMT data so it comes from NFP or the range SMT calculates.

I selected my car M3P 2021. As I send data to Teslalogger since september my data dots should be seen there. I have my teslalogger data at home in my raspberry pie, amshowing a solid 500+ km rang until very recently. Not home right now.

Looking at the graphs its clear that Teslalogger has some cross-placed data so maybe my data points is in some other graph…

For calendar aging, yes. We have discussed it here on TMC before but as the world have a sharp miles focus it probably will not happen. If someone created both people should see that the degradation is more uniform in the view of time.

The zero time is not very important if we use the day of cell or car manufacture. Problably we can use the first day of owners use also.
Seen from lithium battery tests, the batteries that has been in storage after the manufacturing doesnt seem to age much until they are started to get cycled.
A common storage level for new lithium cells is 30%.
I did get 10 pieces of ncr2170 delivered the othet month that was sent at 30%.
(Getting another 25 very soon, and another batch of 8 after that). I gonna kill every battery myth out there ;) )
Thank you very clear!
 
  • Like
Reactions: AAKEE