barry.perfect
Member
I also built my own spreadsheet, built it up of a fair bit of time starting off workinging out where they hell our 17000kwh/year consumption goes (turns out the always on network and server equipment adds up a fair bit, on top of the car and a HP). Mine is really messy tho as it continuously compares 4 different panel & battery combos.
Use PVwatts to get your monthly and daily generation vs usage I then matched what I can move to either high gen or cheap rate electricity and from there worked out savings per day/month/year. Then take that rate and project into the future. I've not accounted for energy price increased other than the obvious near horizon because the more it goes up, the quicker the system pays for its self.
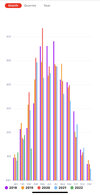
This is my graph at 28p/7.5p, assuming putting what solar you can into the battery, then filling the battery over night if needed (over 25 years):
View attachment 781555
Lines are P (panel count) and b (battery count in KW).
If the day rate goes up to 50p/unit and night to 12p, payback is between 3-4 years:
View attachment 781557
The big array with the 10k battery in this condition puts you £80k up in 25 years.
Thanks for the info on PVWatts, hadn't seen that before sounds like a good resource for doing the ROI maths.
Are you just using the 17000KWh figure and dividing it by 12 for the monthly usage or are you factoring in the higher usage in the winter when you have the least Solar?