Let me try and answer your questions, but if you don't find my answer convincing please feel free to say so, then we can figure out whether I am making an error or whether I am just bad at explaining. Please bear in mind that I am really an engineer and I generally deal with this sort of stuff in the context of project economics. Also, as is usual, the simplest questions are in many ways the most profound and you've asked a zinger.
Here is that China Case table:
View attachment 861708
Firstly in the China Case you are correct that the projection is indeed for an EPS of $41.32 in 2030. Then if you look downwards in my table you will see a red box outline for the PE-version of the share price, and a green box outline for the NPV-version of the shareprice.
Take the red box. Using a PE of 32 in 2030 one simply multiplies $41.32 x 32 = $1322.24. The PEG of 32 is the manual input that drives the output share price of $1322. The EPS=32 is in a tan colour cell as it is a manual input. (You can’t always rely on my colour codes by the way as I do get scatterbrained).
You can also see that this share price of $1322 would result in a trailing PEG of 1.0 which implies perfect valuation (i.e. the valuation at which a shareholder would be indifferent between having one share or $1322 in cash). Personally I think it would be an over-valuation if this scenario were going on as I posses two pieces of knowledge. Firstly I know it is a trailing PE and so it is backwards-looking, this is (or would be in 2030) common knowledge. But I also know what is about to happen next in my spreadsheet which is that 2031 will be exactly the same as 2032. Therefore in this scenario Tesla will stop growing and so this in my opinion would be an over-valuation if this were to come to pass.
This demonstrates the problem faced by a ‘conservative’ investor who insists on only using historical (i.e. trailing) data in arriving at their valuations. When a share is growing they are inevitably undervaluing it, and so can never bring themselves to pay a high enough price to acquire any shares from those who are forwards-looking. Conversely when a share comes off-growth they overvalue it and so pay too much to the forwards looking people who offload and laugh all the way to the bank. So the investor who tries to be very safe actually ends up losing out on the gains on the way up, but then receiving all the losses on the way down. Personally I think ideally investors should be very alert and looking in all directions: forwards, backwards, sideways for bandits, and under rocks for scorpions, and in the sky for hawks.
That is why a few lines further down the spreadsheet also contains a forwards PE and a forwards PEG. The forwards PE is of course still 32 as the EPS in 2031 is the same $41.32 . But if you look closely you will see that the 2029 forwards PEG has gone to 0.9. The 2030 cell is blank because it is #DIV/0! error as growth goes to zero and my spreadsheet tidily does not show that. I guess instead of setting it to go blank I should have put a big warning [!!off-growth!!] output to indicate that a PEG is no longer an appropriate valuation methodology and that investors need to be careful about over-valuations. In my eyes a zero-growth company does not deserve a PE of 32, instead a PE of something in the 7-12 range or even less depending on how safe or risky one feels it may be.
Turning now to the green box. This is the area where the NPV version of the share price is calculated. In the 2030 box it calculates using a NPV formula and a discount rate of 10% a fair price of $398 to go with that $41.32 EPS. This in turn mechanistically yields a PE ratio of 398/41.32 = 9.63 which my spreadsheet rounds to 10. From this you begin to see why people bandy around PE ratios of 7-12 as being appropriate for zero-growth businesses. You can see that the NPV approach is giving an interestingly different view as to the correct valuation, and this is because it looks into the future at the likely stream of EPS coming towards the shareholder each year.
This leads us to your queries about NPV and you give that SeekingAlpha link. Some SA explainers are good and some less so. This one is not great when I read it and I struggle with its way of explain things. Can I please consign it largely to the dustbin. It may be right, but it reads like someone reciting a textbook they themselves did not understand.
Quick Note. In project economics I would look at the project’s cashflow and from that I would understand whether I might get a return on the project investment in the initial year (the zero’th year) or whether I might wait until the first year (1) or perhaps later. With a share it can be tricky to decide which is the first year of return. The excel NPV function actually uses the subsequent year so there is a slight error in my scenario analyses as I forgot that.
With a share we are hoping that all the Net Income per Share (i.e. PROFIT !) will result in a return of value to the shareholder. The simplest way to think of this is that business takes all the profit and distributes it to the shareholders as a dividend at the end of the year, in the case we are looking at this would be the $41.32 Earnings Per Share. A couple of other ways to think of it are possible. One is that the company puts the profit in a bank account and the money accumulates, which the accountants call Retained Earnings and hopefully the bank pays some interest (enough at least to protect from inflation), but again the cash could in the future be distributed to shareholders. A third possibility is that company invests the money wisely in new product development and new factory capacity and that they in turn create additional value in future years. Or the company could do a mixture of all of these – and that is why we mentally ‘count’ all of the EPS as being ultimately potential value to shareholders when doing an NPV analysis.
So I can take the stream of future outputs of $41.32 per share and value them in some way to decide how much to pay to purchase one share. But will Tesla be there for 100-years, or will it go bust in 5-years ? Will you be alive to know ? If you recall the Charlie Brown cartoon you know that Lucy always pulls the football away and it goes wrong. We learn early as children that a sweet in our hand is worth more than the same one that is promised later, because stuff happens. It is the same with money – getting $41.32 today is better than getting the same $41.32 next year as inflation, death, bankruptcy, competition, devaluation, recession all might come along. Depending on how we feel about things we ascribe a percentage factor to our view of how much we should discount the future value to allow for this. In advanced valuations we might put in specific discount factors for individual years, for example if we think that a war will happen in year 3 and 4 that merits a 40% discount factor to account for likely bomb damage to the factory; but that in the other years we are just concerned about less worrying things worth say 8% a year. However in most normal work we use the same discount rate throughout the whole of a project, say 10% or 14% or 3% or whatever.
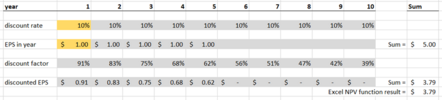
So with a discount rate of 10% per year in mind if I give you something of value now and you promise to give me a $1.00 dollar cash straight back to me I value that promise as being worth $1.00 to me. But if I give you $1.00 now and you promise to give it back a year later, then I only value that promise as being worth $0.91 in today’s equivalency (i.e. $1.00 x (1/(1.1^1)) = $0.91 where the 1.1 is 100%+10% expressed as a decimal, i.e. 100+Rate%). But the promise of a return two years later is worth another 10% discount, so $1.00 x 1/(1.1^2) = $0.83.
So if I were to give you something of value today, and if your doctor were to privately tell me you are going to drop dead in a few years, then I might value future stream of infinite promises as being worth $1.00 + $0.91 + $0.83 + $0.75 …. etc. So if you wanted cash today with first repayment next year and I figured I’d get three payments before you dropped dead and your stream of infinite promises evaporated into thin air then I’d be prepared to give you no more than $2.49 for that promise. And that is basically how we use NPV to assess a share price if we think that there would be nothing substantial of value left at the end. If we thought there might be a payout in the end then we’d take that into account as well but discount that also.
In a normal world we can then build a valuation table like this, assuming that we receive the first return on our investment in year after we invest (which may not be the case). This is of course the no-growth version, and I will assume that the company goes terminally bankrupt after 5-years with no residual value left. There is also an Excel function for NPV calculations and I have put that number in the lower right to check that we can trust Excel’s workings. So in this case I would be technically “indifferent” to pay $3.79 for a share in this company, or alternatively I would consider the $3.79 to be perfectly priced and assuming that the company doesn’t decline in performance or drop dead a year early. If I paid $3.00 then I might think I was getting a good deal, and if I paid $4.00 I would probably be guilty of overpaying. And as you can see we can trust Excel to do the sum for us provided we use the NPV function correctly.
View attachment 861711
Now let’s consider what happens to our zero-growth company if we think it will go on forever. Here are a series of tables showing how the duration being valued makes a difference, always from the perspective of the investor in the Zero’th year. The question that will immediately spring to mind is whether it is meaningful to value a commercial business of zero-growth 15 or 20 years into the future. As you can see the zero growth business is getting pretty fully valued after 10 years, and because of discounting the additional value that the investor might be prepared to pay for returns out to 15 years or even 20 years becomes relatively unimportant.
Valuation out to 5 years = $3.79
Valuation out to 10 years = $6.14
Valuation out to 15 years = $7.61
Valuation out to 20 years = $8.51
View attachment 861712
But what happens if this is a growth company. Let’s do the same exercise again but this time assuming the company grows at 20% per year :
Valuation out to 5 years = $5.45
Valuation out to 10 years = $13.87
Valuation out to 15 years = $26.88
Valuation out to 20 years = $46.99
Now all of a sudden the prospect of long term sustained growth becomes very interesting. But the time horizon of the analyst becomes a major factor in determing what they might consider to be fair value.
View attachment 861713
And here is the same company growing EPS at 50% per year for 10-years, but then flatlining for the second 10-years. You will recognise this as the underlying Tesla Base Case.
Valuation out to 5 years = $9.29
Valuation out to 10 years = $53.08
Valuation out to 15 years = $109.27
Valuation out to 20 years = $144.15
View attachment 861714
The final point to consider is that in the examples above I have only viewed the situation from the perspective of an observer contemplating share purchase and standing in the Zero’th year. But in the actual Base Case and China Case scenario analysis I have also considered the situation from the perspective of a share purchaser standing in subsequent years. In the PE-driven calculations that is implicit. In the NPV-driven calculations I simply shunt the zero’th year forwards one year at a time to get an equivalent result. This in turn implies looking 20+ years forward from a standpoint that is already 10-years in the future, which is very brave 30-year forecasting, but necessary if one is to do a scenario analysis like this.
It may of course be that I have missed something. If so please say so.
My personal opinion is that high growth shares are so sensitive to the underlying assumptions that equally sensible people can come up with equally valid but wildly different valuations depending on which methodology they are using, and what methodological assumptions they are using (time horizon, discount rate) even if they were to be considering the same set of business data (for example agreeing on growth rate). When a business has a market capitalisation as great as Tesla is now ($1-trillion of a global stock market valued at approx. $100-trillion) and one goes on to consider where Tesla might be in 10-years with say a market cap that is 5% of the entire world stock market it is no wonder that valuations vary wildly.
When we add in the possible effects of different business scenarios I personally am pleasantly surprised if the ‘now’ valuation only goes down by approx. $100 share in a more pessimistic scenario (due to potential of stronger than anticipated China competition) with current share price at approx. $220/share. Equally I recall that a week or so ago I sketched out a more optimistic scenario than the base case that resulted in perhaps a doubling in the future size of the business due to the potentially greater return from the robotics sector. Funnily enough people seem not to like to hear downside scenarios ad much prefer upside scenarios.
My other take-away with exercises of this nature is that I respect and listen more attentively to those who do their own parallel modelling, as they are as aware as I am of the pitfalls. Those who do handwaving without running the numbers may also be correct, but they have far less sense of perspective. Even sketchy calculations add considerable value to qualitative opinions.
Please excuse the length of response, and I hope this helps.