The most efficient freeway speed for a BEV varies depending on the model and the driving conditions. The general consensus is that the energy efficiency starts going down fast at higher speeds as the electric motor's power requirements keep going up. Where can we find a right balance of speed vs efficiency? Today, my wife and I took a ride on my 2023 Tesla MYLR7 at a constant speed of 45 miles per hour. I know, it sounds strange, but yes we did. It was a fun drive, and this largely flat stretch of the freeway was posted at 55 mph. So we were able to legally do 45 mph (The minimum speed on freeways is typically 15 mph below the posted speed limit). We drove a 30 mile stretch at 45 mph. My energy consumption was averaging around 165 wh/mile in the Tesla energy application. At this rate of energy consumption, I averaged out my range mileage data points and came to a total range estimate of about 470 miles. Now, if all other variables of driving dynamics were constant, I'm curious to find out how the range is affected by the vehicle speed. Has anyone compiled a spreadsheet and chartered a graph of their MY/3 at various constant speeds (45, 55, 65,or 75 mph) versus range? Or, we can crowd source it on the TMC forum right here, and report it on this thread. Any MY/3 volunteers?


Welcome to Tesla Motors Club
Discuss Tesla's Model S, Model 3, Model X, Model Y, Cybertruck, Roadster and More.
Register
Install the app
How to install the app on iOS
You can install our site as a web app on your iOS device by utilizing the Add to Home Screen feature in Safari. Please see this thread for more details on this.
Note: This feature may not be available in some browsers.
-
Want to remove ads? Register an account and login to see fewer ads, and become a Supporting Member to remove almost all ads.
You are using an out of date browser. It may not display this or other websites correctly.
You should upgrade or use an alternative browser.
You should upgrade or use an alternative browser.
Constant Driving Speed of a BEV Versus its Range
- Thread starter HMHM
- Start date

father_of_6
Membler
I've seen a graph on these forums somewhere and if I recall correctly, the efficiency curve takes off (in the bad direction) when getting above 55. It might take twice the energy to drive at 80mph than it does to drive 55.
Of course though, the slower the better. These guys got 606 miles out of a Model 3 staying between 20-35mph:
 www.teslarati.com
Of course though, the slower the better. These guys got 606 miles out of a Model 3 staying between 20-35mph:
Tesla Model 3 surpasses 600-mile mark in hypermile Guinness attempt
Less than a couple of weeks since setting a hypermile run record for the Model 3, Denver Tesla Club president Sean Mitchell, accompanied by Erik Strait, a fellow Tesla owner and host to a popular YouTube channel, managed to push the compact electric car 606.2 miles on a single charge, possibly...
www.teslarati.com
father_of_6
Membler
A long time ago Tesla published this info for the original Roadster and the Model S. It's still on their website.
Hmm... theirs is a steady decline, but I could swear the efficiency drops exponentially above 55.
ChadS
Last tank of gas: March 2009
A long time ago Tesla published this info for the original Roadster and the Model S. It's still on their website.
Based on that data, I drew up some charts for the Roadster and Model S that included HVAC effects. The top line in both charts is Tesla's data; and the shaded area below is range that could be lost depending on HVAC settings. These calculations were for resistive heating, so most of the time a heat pump should perform better. Unless it's so cold the heat pump is very inefficient because it's near its limit...
(HERE is the 2010 article I created the Roadster chart for)
Ciaopec
Active Member
All of these graphs are great. Real world I don't want to be doing the minimum and if I'm making a long haul , two day trip I want it to be as short as possible. Based on all that my experience is 75mph is the right speed for me. Five miles an hour more or less over the course of a 12 hour day is 60 miles +/-. If you're worried about range and making it to the next charger, then by all means slow down. I don't plan that way but know that if I need to I can always slow down. I plan my trips around a 5% to 55% +/- state of charge. I can't remember the last time I was forced to charge above that number. I do on occasion but it's along with a planned meal break.
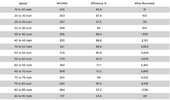
I found this Reddit image, source unknown.Based on that data, I drew up some charts for the Roadster and Model S that included HVAC effects. The top line in both charts is Tesla's data; and the shaded area below is range that could be lost depending on HVAC settings. These calculations were for resistive heating, so most of the time a heat pump should perform better. Unless it's so cold the heat pump is very inefficient because it's near its limit...
View attachment 937546
(HERE is the 2010 article I created the Roadster chart for)
View attachment 937547
Attachments
Consider than for every 10 MPH you reduce your highway speed below 80 MPH your driving efficiency increases by ~8% to 10%. Start out slower and increase your speed, if desired, the closer you get to your destination or the next Supercharger.
Sounds good. However, based on your experience, can you pinpoint a sweet spot between 55 and 80 mph that is a good speed/range comprise for you?Consider than for every 10 MPH you reduce your highway speed below 80 MPH your driving efficiency increases by ~8% to 10%.
IMHO 62 or 63 MPH yields the best combination of speed and efficiency. It is tempting to drive at higher speeds but I try and limit my highway speed to under 75 MPH.Sounds good. However, based on your experience, can you pinpoint a sweet spot between 55 and 80 mph that is a good speed/range comprise for you?
Since efficiency declines in a linear fashion, there's no specific "sweet spot." So many external variables: elevation change, wind resistance/variability, TPMS, ambient temp/humidity as it affects air density.Sounds good. However, based on your experience, can you pinpoint a sweet spot between 55 and 80 mph that is a good speed/range comprise for you?
Mostly opinion, of course.
HenryT
Active Member
Looking at the chart of the effect of speed on range, efficiency and consumption the change is not linear. It may appear linear within a narrow range of speed but it is definitely a curve. Air resistance (drag) is an exponential function of speed. Drag increases with the square of the velocity between the object (vehicle) and the air.
Ciaopec
Active Member
My sweet spot in 160,000 highway miles is 75mph. That usually puts me 5mph over in some states; 5mph under in others; spot on in the remainder. Still, for me the way I plan and charge it works and I have experimented over the years. I personally think my 2016 MS 90D does better than the 2021 MYLR but I am nearly positive that is unsupportable bias.Sounds good. However, based on your experience, can you pinpoint a sweet spot between 55 and 80 mph that is a good speed/range comprise for you?
Of course, you're correct. I should have said "curvilinear," implying that the change in efficiency is so gradual that to find a sweet spot is next to impossible.Looking at the chart of the effect of speed on range, efficiency and consumption the change is not linear. It may appear linear within a narrow range of speed but it is definitely a curve. Air resistance (drag) is an exponential function of speed. Drag increases with the square of the velocity between the object (vehicle) and the air.
ewoodrick
Well-Known Member
I'm going to turn that around slightly, for every 5 mph above 60 mph, you can expect a decrease of about 10% range.Consider than for every 10 MPH you reduce your highway speed below 80 MPH your driving efficiency increases by ~8% to 10%. Start out slower and increase your speed, if desired, the closer you get to your destination or the next Supercharger.
It's really easy to see. Get on a flat, straight road and look at the Energy graphs when driving each speed for about 15 minutes.
ewoodrick
Well-Known Member
The part that people seldom think about is "Why does it matter"My sweet spot in 160,000 highway miles is 75mph. That usually puts me 5mph over in some states; 5mph under in others; spot on in the remainder. Still, for me the way I plan and charge it works and I have experimented over the years. I personally think my 2016 MS 90D does better than the 2021 MYLR but I am nearly positive that is unsupportable bias.
Sure, we know that it uses more energy and costs more, but so what.
On a long trip, is it going to change the number of stops you have to take to refill?
How much time is it going to add to the stops?
The answer is that it really doesn't make much difference.
But if you have a big gap between chargers or have the opportunity to skip a charge, it may make enough difference to allow you to get there.
But in most cases, you won't notice difference that matters. That's why 75 mph actually works.
There were some folks who did some studies a few years back and they determined that the fastest way to travel was to keep the battery as empty as possible (to charge faster) and then somewhere around 75 mph was the best speed. Personally, I found some faults in their algorithms, but they at least make you think.
BitJam
Active Member
Drag cannot be both exponential and polynomial!Air resistance (drag) is an exponential function of speed. Drag increases with the square of the velocity between the object (vehicle) and the air.
The drag equation tells us drag force increases as the velocity squared. This means drag power (e.g. watts) goes as velocity cubed because power equals force times velocity. In other words, if we only consider air resistance (in a range of velocities where the drag equation is valid) then range decreases as the velocity cubed.
Over a limited span of velocities 1/v^3 may look like an exponential but it's not and the difference is important. For example, if the rocket equation were cubic and not exponential then people would probably be living on Mars already (depending on leading coefficients, etc).
Here is a good introduction to aerodynamic drag:

Aerodynamic Drag – The Physics Hypertextbook
Drag is the friction from fluids like air and water. A runner feels the force of aerodynamic drag. A swimmer feels the force of hydrodynamic drag.
 physics.info
Last edited:
father_of_6
Membler
Drag cannot be both exponential and polynomial!
The drag equation tells us drag force increases as the velocity squared. This means drag power (e.g. watts) goes as velocity cubed because power equals force times velocity. In other words, if we only consider air resistance (in a range of velocities where the drag equation is valid) then range decreases as the velocity cubed.
Over a limited span of velocities 1/v^3 may look like an exponential but it's not and the difference is important. For example, if the rocket equation were cubic and not exponential then people would probably be living on Mars already (depending on leading coefficients, etc).
Here is a good introduction to aerodynamic drag:
Aerodynamic Drag – The Physics Hypertextbook
Drag is the friction from fluids like air and water. A runner feels the force of aerodynamic drag. A swimmer feels the force of hydrodynamic drag.
Yeah, this is exactly what I was gonna say!

ItsNotAboutTheMoney
Well-Known Member
Drag cannot be both exponential and polynomial!
The drag equation tells us drag force increases as the velocity squared. This means drag power (e.g. watts) goes as velocity cubed because power equals force times velocity. In other words, if we only consider air resistance (in a range of velocities where the drag equation is valid) then range decreases as the velocity cubed.
Over a limited span of velocities 1/v^3 may look like an exponential but it's not and the difference is important. For example, if the rocket equation were cubic and not exponential then people would probably be living on Mars already (depending on leading coefficients, etc).
Here is a good introduction to aerodynamic drag:
Aerodynamic Drag – The Physics Hypertextbook
Drag is the friction from fluids like air and water. A runner feels the force of aerodynamic drag. A swimmer feels the force of hydrodynamic drag.
If drag only:
energy = force x distance.
capacity = force x range
range = capacity / force ∝ energy / velocity squared.
Similarly
energy = power x time
capacity = power x time between charges
time between charges = capacity / power ∝capacity / velocity cubed
Similar threads
- Replies
- 102
- Views
- 4K
- Replies
- 28
- Views
- 2K
- Replies
- 7
- Views
- 202
- Locked
- Replies
- 70
- Views
- 5K