


Welcome to Tesla Motors Club
Discuss Tesla's Model S, Model 3, Model X, Model Y, Cybertruck, Roadster and More.
Register
Install the app
How to install the app on iOS
You can install our site as a web app on your iOS device by utilizing the Add to Home Screen feature in Safari. Please see this thread for more details on this.
Note: This feature may not be available in some browsers.
-
Want to remove ads? Register an account and login to see fewer ads, and become a Supporting Member to remove almost all ads.
You are using an out of date browser. It may not display this or other websites correctly.
You should upgrade or use an alternative browser.
You should upgrade or use an alternative browser.
wraithnot
Model 3 VIN #2942 Model S VIN #5785
Here is my data point:

I'm currently at 341 Wh/mi for the 1112 miles since I picked the car up at the factory on March 2nd, but I expect this number will decrease a bit as I've now given test rides to most of my friends and family")
I got a much more frugal 303 Wh/mi for my commute into work this morning. But that number would have been higher if traffic hadn't kept me from going as fast as I wanted to go . . .
I live in California, have a standard 85 kWh Model S with the 19" wheels, air suspension, and no sun roof.
I'm currently at 341 Wh/mi for the 1112 miles since I picked the car up at the factory on March 2nd, but I expect this number will decrease a bit as I've now given test rides to most of my friends and family
I got a much more frugal 303 Wh/mi for my commute into work this morning. But that number would have been higher if traffic hadn't kept me from going as fast as I wanted to go . . .
I live in California, have a standard 85 kWh Model S with the 19" wheels, air suspension, and no sun roof.
EarlyAdopter
Active Member
mnx
2018 M3P
update:
3131.4km 742.7kWh
converted to miles: 1945.76mi
Wh/mi: 382
# has come down a bit primarily due to warmer weather...
Ontario, P85, 19"
3131.4km 742.7kWh
converted to miles: 1945.76mi
Wh/mi: 382
# has come down a bit primarily due to warmer weather...
Ontario, P85, 19"
Jeff Miller
Member
Total
wh/mile
avg 363
median 362
stdev 37
By State:
State Wh N Miles
1 AZ 308 1 3341
2 CA 351 24 77162
3 CO 349 3 7865
4 FL 322 2 6739
5 GA 321 2 5794
6 IL 379 10 16484
7 MA 345 1 900
8 MD 375 1 10000
9 MN 405 3 9715
10 MO 372 2 6256
11 NJ 382 2 4500
12 NV 314 1 1600
13 NY 366 1 3000
14 OH 381 1 6028
15 ON 382 1 1946
16 OR 418 3 5251
17 QC 380 1 750
18 TX 333 4 8200
19 VA 342 1 3600
By Battery:
Battery Wh N Miles
1 60 333 9 13849
2 85 367 57 175629
By Wheel:
Wheel Wh N Miles
1 19 352 36 90091
2 21 370 23 71553
By Battery and Wheel:
Battery Wheels Wh N Miles
1 60 19 333 9 13849
2 85 19 359 27 76242
3 85 21 370 23 71553
By Battery, State, and Wheel:
State Battery Wheels Wh N Miles
1 AZ 85 21 308 1 3341
2 CA 60 19 321 4 7444
3 CA 85 19 338 7 21786
4 CA 85 21 372 10 37398
5 CO 85 19 352 2 5100
6 CO 85 21 343 1 2765
7 FL 85 21 340 1 1600
8 GA 85 19 321 2 5794
9 IL 60 19 348 2 2890
10 IL 85 19 390 4 5850
11 IL 85 21 378 3 5944
12 MA 85 21 345 1 900
13 MN 60 19 367 1 1015
14 MN 85 19 384 1 7100
15 MO 85 19 340 1 4356
16 NJ 60 19 340 1 900
17 NV 60 19 314 1 1600
18 NY 85 19 366 1 3000
19 OH 85 19 381 1 6028
20 ON 85 19 382 1 1946
21 OR 85 19 397 1 1565
22 OR 85 21 426 1 3000
23 QC 85 19 380 1 750
24 TX 85 19 335 3 5200
25 VA 85 21 342 1 3600
26 WA 85 19 392 2 7767
27 WA 85 21 400 3 5935
Data:
Wh Miles State Battery Wheels N
GeekGirls 318 3000 CA 85 19 1
MitchL 383 3300 CA 85 21 1
efusco 340 4356 MO 85 19 1
mcornwell 359 3000 CA 85 21 1
FlasherZ 403 1900 MO NA NA 1
Zythryn 384 7100 MN 85 19 1
raptorweb 465 1600 MN 85 NA 1
stevezzz 338 5100 CO 85 19 1
ckessel 426 3000 OR 85 21 1
kvietor 303 5139 FL NA NA 1
Jason S 351 4334 CA 85 NA 1
rcc 365 3500 CA 85 NA 1
brianman 415 NA <NA> NA NA 1
Sparrow 286 2650 GA 85 19 1
Andrew Wolfe 343 2700 CA NA NA 1
drbradfo 430 686 OR NA NA 1
gg_got_a_tesla 322 3000 CA 60 19 1
Chgd Up 353 8400 <NA> NA NA 1
jhs_7645 399 558 WA 85 21 1
ddenboer 359 8500 CA 85 21 1
dlmorgan999 397 1565 OR 85 19 1
NJS1207 424 3600 NJ 85 NA 1
pilotSteve 422 1767 WA 85 19 1
tezco 366 NA CO 85 19 1
eelton 425 750 IL 85 19 1
spatterso911 354 2000 CA 85 21 1
Ben W 370 5000 CA 85 21 1
bob_p 326 3000 TX 85 NA 1
aaron.s 366 3000 NY 85 19 1
Zextraterrestrial 391 5600 CA 85 21 1
mnx 382 1946 ON 85 19 1
Cliff Hannel 345 4100 CA 85 19 1
Banahogg 307 1205 CA 60 19 1
digitaltim 375 10000 MD 85 NA 1
StephRob1 387 4938 CA 85 21 1
StephRob2 336 1054 CA 60 19 1
ElSupreme 356 3144 GA 85 19 1
Vexar 367 1015 MN 60 19 1
kcveins 391 1300 IL 85 19 1
Lloyd 370 3000 CA 85 21 1
IlliniT 330 1400 IL 60 19 1
Tommy 336 8200 CA 85 19 1
mark 391 1700 TX 85 19 1
Cattledog 354 3000 TX 85 19 1
youlikeadajuice 340 900 NJ 60 19 1
Beavis 343 2765 CO 85 21 1
Nickjhowe 340 1600 FL 85 21 1
gregincal 330 500 CA 85 19 1
ChadS 361 6000 WA 85 19 1
captain_zap 385 4004 WA 85 21 1
Kipernicus 320 2185 CA 60 19 1
Darmok 314 1600 NV 60 19 1
gtimbers 330 900 CA 85 19 1
bosgig 345 900 MA 85 21 1
David Trushin 378 1100 IL 85 19 1
Vern110 407 1800 IL 85 NA 1
drp 340 1200 IL 85 21 1
jerry33 260 500 TX 85 19 1
matthew.johnson 407 3500 IL 85 21 1
tdiggity 345 760 CA 85 21 1
toto 380 750 QC 85 19 1
Bucket22 387 1244 IL 85 21 1
araxara 308 3341 AZ 85 21 1
jjaeger 363 3974 CA 85 19 1
ibcs 381 6028 OH 85 19 1
XK8driver 342 3600 VA 85 21 1
Jason 344 7070 <NA> 85 21 1
wraithnot 341 1112 CA 85 19 1
EarlyAdopter 415 1373 WA 85 21 1
dtich 402 1300 CA 85 21 1
lholtzman 364 2700 IL 85 19 1
Brad-isa 365 1490 IL 60 19 1
KKlabunde
Member
Al Sherman
It's about THIS car.
OK Kenneth. Was gonna wait for more miles but here's another Indiana.
Al Sherman- 500 miles- 336 wh/mi- Performance- 21" tires
Al Sherman- 500 miles- 336 wh/mi- Performance- 21" tires
Here is mine so far: WA, first ~1000 on 21", the majority on 19" all weather
March 1-22: 1069.7 mi 404.3 kWh 378 Wh/mi
Lifetime: 4878.9 mi 1909.5 kWh 391 Wh/mi
One thing - i've started using the Trip A for a monthly rate, and it's better than the lifetime. Most WA folks have been reporting 380-420 lifetime so far, but i expect during the spring and definately during summer i will see a lot lower average Wh/mi. If you really want to see how it varies by state you also need by month to account for cold & rainy winters.
Jeff Miller
Member
If you really want to see how it varies by state you also need by month to account for cold & rainy winters.
State averages by themselves will (over time) reflect average mileage over the year in that state which is interesting because this average is likely to vary
considerably between states with different climates. But I agree that it would be very interesting to know how mileage varies with season (a proxy for temperature and precipitation). Doing so requires however that people keep track of their milage by month which takes more effort, although your idea of using Trip A for the month and Trip B for the total is a good one. If people want to post or send me their monthly averages (one additional field = month/year), I could try to keep track of them and do the averages by month, state, etc.
toto_48313
CAN P #5
One thing - i've started using the Trip A for a monthly rate, and it's better than the lifetime. Most WA folks have been reporting 380-420 lifetime so far, but i expect during the spring and definately during summer i will see a lot lower average Wh/mi. If you really want to see how it varies by state you also need by month to account for cold & rainy winters.
Very good idea, I'll start the same in April. As i just switch from Winter 19 to summer 21 have the monthly one is even better as the overall become a mix of 19 and 21 wheels
I reset trip A for EVERY trip(WTF!) and B for my overall total. (28 journal pages so far )
I want to switch to just using A for each time I charge but might try to wait until after summer If I can keep up my obsessive behavior that long
)I want to switch to just using A for each time I charge but might try to wait until after summer If I can keep up my obsessive behavior that long
Al Sherman
It's about THIS car.
I reset trip A for EVERY trip(WTF!) and B for my overall total. (28 journal pages so far
I want to switch to just using A for each time I charge but might try to wait until after summer If I can keep up my obsessive behavior that long
OMG! I'd kill myself.
... If you really want to see how it varies by state you also need by month to account for cold & rainy winters.
It actually is quite fascinating.
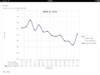
I have been tracking daily miles, kWh and temps.
While monthly numbers show a trend, it is pretty noisy.
If, instead, you plot Watts/Mile vs temperature the trend is a lot cleaner. Temp average is pretty easy if you use the National Weather Services numbers. I use 5 degree blocks for temperature.
There is also a pretty strong relationship with daily mileage, I am guessing especially in cold. As the Model S is extremely inefficient in the first few miles of travel while the batteries and cabin are warmed up.
Attachments
Last edited:
SuperCoug
Model S Res #7734
It only took 11 days to log 1,000 miles doing my regular commute. Seattle temps have generally been mild (except for the 3 inches of snow at my house this morning).
Lifetime 368 kWh/mile with lots of test drives and spirited driving. I'm very pleased so far considering that I've driven relatively aggressively and I have not shied away from the climate controls.
Lifetime 368 kWh/mile with lots of test drives and spirited driving. I'm very pleased so far considering that I've driven relatively aggressively and I have not shied away from the climate controls.
This brings up a good point. I hope they add a lifetime row to the UI before I accidentally screw up my meters by resetting them.OMG! I'd kill myself.
toto_48313
CAN P #5
It actually is quite fascinating.
I have been tracking daily miles, kWh and temps.
While monthly numbers show a trend, it is pretty noisy.
If, instead, you plot Watts/Mile vs temperature the trend is a lot cleaner. Temp average is pretty easy if you use the National Weather Services numbers. I use 5 degree blocks for temperature.
There is also a pretty strong relationship with daily mileage, I am guessing especially in cold. As the Model S is extremely inefficient in the first few miles of travel while the batteries and cabin are warmed up.
That's excellent, and shows that the average curve is almost a strait line going from 500 at 0 to 325 a 55 .
Thanks for your input.
Similar threads
- Replies
- 1
- Views
- 2K
- Locked
- Replies
- 70
- Views
- 7K
- Replies
- 5
- Views
- 1K
- Replies
- 3
- Views
- 2K