Welcome to Tesla Motors Club
Discuss Tesla's Model S, Model 3, Model X, Model Y, Cybertruck, Roadster and More.
Register

LR True Range -- Part II, Early Evidence

This site may earn commission on affiliate links.

ForeverFree

Member
Supporting Member
Jul 9, 2015
640
1,446
Sherman Oaks, CA
In a spirit of pure scientific inquiry -- no hedonic pleasure, us -- we took our M3 up into the local mountains yesterday. Our route:

Sherman Oaks (San Fernando Valley) up to Mt. Waterman (San Gabriel Mountains) and back.

53 miles each way.

Elevation 900 feet --> 7000 and back.

Mix of freeway and mountain highway.
Eager to see whether Tesla handled 335 --> 310 down-rate by:

Hiding capacity at top.

Hiding capacity at bottom.

Making RMs more realistic in between.
Preliminary evidence suggests they've gone primarily with door #3.

Trip up used 94 RMs (versus 110-ish) in our S85D.

Trip down used 9 RMs (versus 10-15) in our S85D.

Round trip used 103 RMs to go 106 actual miles.

This was at energy usage of 226 Wh/mi. Suggests "break-even" (to get rated range) just under 235.

Remote S charging data suggested just over 235.
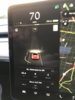
Also noteworthy: M3's efficiency. As the photos below show, we gained 2 kWh, an average of 40 Wh/mi, on the 38-mile descent from Waterman to 134 Freeway ... more than we ever had in our MS. And, we didn't hit our net-zero point until just before the 134/101 transition, 45 miles ... better than we had ever done in our MS.
 

Attachments

  • GNw54ftYSRa0lLY8ZvPJJQ.jpg
    GNw54ftYSRa0lLY8ZvPJJQ.jpg
    648.8 KB · Views: 239
  • YmsKafeOQ5Kn1LRq5Zho4Q.jpg
    YmsKafeOQ5Kn1LRq5Zho4Q.jpg
    428.7 KB · Views: 197
  • P8WnRLt1TCGHZLFDZ%nziw.jpg
    P8WnRLt1TCGHZLFDZ%nziw.jpg
    335.8 KB · Views: 207
  • yiCNgUlHSnuwMJs30nDq9Q.jpg
    yiCNgUlHSnuwMJs30nDq9Q.jpg
    367.5 KB · Views: 189
  • 8iFpV%rWSwiomZE6H85j8Q.jpg
    8iFpV%rWSwiomZE6H85j8Q.jpg
    313.1 KB · Views: 195
  • sztG1WJMRzyFLXlnEsEsCA.jpg
    sztG1WJMRzyFLXlnEsEsCA.jpg
    298.5 KB · Views: 189
Only one data point so far, but it appears the 18" aero wheels are significantly more efficient than what 19" sport wheel owners are reporting.

If the aero wheel efficiencies really do keep hovering around these numbers, it's going to make SR/aero wheel a really viable option for many that would otherwise have to opt for LR.

Thanks for posting, and please keep reporting new numbers.
 
Last edited:
  • Like
Reactions: suwaneedad
I just remembered this, from the Tesla Podcast M3 Palo Alto to Kettleman City SC run. They stated the stated RM was quite inaccurate at the start of the leg, while the estimated SOC upon arrival was spot on.

I took that to mean take the estimated SOC at destination as your "will I make it" gauge (until the RM becomes more accurate). Maybe they have fixed the RM inaccuracy with the new mapping update?

Something to ponder.
 
What's an RM? What is your conclusion regarding actual Wh/mile? I'm so confused.

RM is the abbreviation for "rated miles" or "range miles." The gauge that displays remaining range is merely an estimate based upon ideal conditions, speed, acceleration. Tesla uses these rated miles to compare battery sizes. Degradation of the battery will reduce the rated miles slightly over time. We have lost approximately 4% in 43 months and 44,000 miles.

Typically, in order to achieve rated miles one must average about 280-something watt-hours per mile in our 2014 S85. Use more, and rated miles decreases. The converse is true too.

I think this a pretty accurate summary. I am sure someone with more intimate knowledge will correct my misstatements.
 
Only one data point so far, but it appears the 18" aero wheels are significantly more efficient than what 19" sport wheel owners are reporting.

If the aero wheel efficiencies really do keep hovering around these numbers, it's going to make SR/aero wheel a really viable option for many that would otherwise have to opt for LR.

Thanks for posting, and please keep reporting new numbers.

That would be great, from where are you pulling your data? Do you have real-world data comparing the 18" and 19" wheels... I'm curious what the kWh/mi difference is. I probably just missed it, but I don't see where the OP mentioned the wheel size they are using.[/QUOTE]
 
That would be great, from where are you pulling your data? Do you have real-world data comparing the 18" and 19" wheels... I'm curious what the kWh/mi difference is. I probably just missed it, but I don't see where the OP mentioned the wheel size they are using.
[/QUOTE]
Hmmm I could have sworn I saw a posting by the OP somewhere it had the aero's. Now I can't find said reference, may be the effects of middle age :confused: . Disregard my aero comments until confirmation please.
 
Here's the aero reference:
First Drive in Mountains -- Angeles Crest Highway

Whew not losing it entirely yet ;) .

19" sport data (again pulled from memory YWHPM may vary):
Tesla podcast, 183 mile run Palo Alto to Kettleman City, 307 Wh/m
You-you Gilroy Ca to San Diego to Santa Fe, 281 Wh/m
Now you know, mixed driving, cold climate, ~289 Wh/m

Thanks for that, so from the OP we have 226 Wh/m on the aeros.... which equates ot about 320 miles range (If I did the calculations correctly), and from the 19" data we have an average of 292 Wh/m for a range of 257 miles.

I wonder if anyone has created a thread with a spread sheet where people can enter this data so we can get a bigger data set? I would create it, but I have a habit of creating threads just be told there are already 20 threads on the subject.:confused:
 
  • Like
Reactions: Robert831
Until the OP chimes in to confirm his numbers, I think the 226 Wh/m was his consumption for an atypical trip (lots of spirited uphill consuming lots of energy, lots of downhill creating lots of regen).

I was more interested in his 235 Wh/m number and how it might equate to a more typical trip range (i.e. cross country travel at 65-75mph). I saw one aero wheel road trip with a reported 250 Wh/m reported (I'll try to find that report again as well).

If the 19" is around 280-300 Wh/m, and the 18" is indeed around 240-250 Wh/m, now that is exciting to me:
19", LR battery, 70% SOC usage supercharger hops = 180 miles range
18", SR battery, 70% SOC usage supercharger hops = 143 miles range
37 miles more SC range at a $10.5K difference (not to dismiss the other LR advantages; faster charging, more reserve capacity on tap, better acceleration)
For those that live in warmer climates, and will not travel often beyond supercharger dense areas, there appears to be an opportunity to save some serious coin. Flipside, those living in colder climates, or traveling often in non-supercharger dense areas, have an even greater opportunity to maximize range and trip completion comfort with the LR/aero combo.

Anyways sorry thread hijack, my apologies. Just really exited by ForeverFree's excellent real world feedback on what an M3 is like. Has been some of the most helpful info I have received.
 
Last edited:
Until the OP chimes in to confirm his numbers, I think the 226 Wh/m was his consumption for an atypical trip (lots of spirited uphill consuming lots of energy, lots of downhill creating lots of regen).

I was more interested in his 235 Wh/m number and how it might equate to a more typical trip range (i.e. cross country travel at 65-75mph). I saw one aero wheel road trip with a reported 250 Wh/m reported (I'll try to find that report again as well).

If the 19" is around 280-300 Wh/m, and the 18" is indeed around 240-250 Wh/m, now that is exciting to me:
19", LR battery, 70% SOC usage supercharger hops = 180 miles range
18", SR battery, 70% SOC usage supercharger hops = 143 miles range
37 miles more SC range at a $9K difference (not to dismiss the other LR advantages; faster charging, more reserve capacity on tap, better acceleration)
For those that live in warmer climates, and will not travel often beyond supercharger dense areas, there appears to be an opportunity to save some serious coin. Flipside, those living in colder climates, or traveling often in non-supercharger dense areas, have an even greater opportunity to maximize range and trip completion comfort with the LR/aero combo.

Anyways sorry thread hijack, my apologies. Just really exited by ForeverFree's excellent real world feedback on what an M3 is like. Has been some of the most helpful info I have received.


I like how you are using 70% numbers, since that is truly the most practical portion of the battery pack. With the 18" LR it would be 214, which is 71 mile difference at 70%.

Now our highjack of this thread is complete... bwa, ha, ha :D
 
Yea most people give me "disagrees" when I use real world supercharger trip 60-70% SOC usage range numbers. I will remember to smile as I drive by them on the side of the road :rolleyes: .

Just kidding of course. I would always help if I can.
 
Last edited:
If you gained 2 kWh over 38 mile descent then your efficiency is not 40 wh/mile but -52 wh/mile.

What do you mean net zero point?


Of course, you're mathematically spot-on.

The display showed both -2 kWh usage and -40 Wh/mi usage rate. Assuming the -40 was correct, that would imply -1.6 usage. However, since the software no longer shows a tenths value, it rounded off to -2.

As for net zero, i meant that it wasn't until 45 miles into the descent that the numbers crept back up to 0 and 0. Zero net energy use over 45 miles.
 
Until the OP chimes in to confirm his numbers, I think the 226 Wh/m was his consumption for an atypical trip (lots of spirited uphill consuming lots of energy, lots of downhill creating lots of regen).

I was more interested in his 235 Wh/m number and how it might equate to a more typical trip range (i.e. cross country travel at 65-75mph). I saw one aero wheel road trip with a reported 250 Wh/m reported (I'll try to find that report again as well).

If the 19" is around 280-300 Wh/m, and the 18" is indeed around 240-250 Wh/m, now that is exciting to me:
19", LR battery, 70% SOC usage supercharger hops = 180 miles range
18", SR battery, 70% SOC usage supercharger hops = 143 miles range
37 miles more SC range at a $10.5K difference (not to dismiss the other LR advantages; faster charging, more reserve capacity on tap, better acceleration)
For those that live in warmer climates, and will not travel often beyond supercharger dense areas, there appears to be an opportunity to save some serious coin. Flipside, those living in colder climates, or traveling often in non-supercharger dense areas, have an even greater opportunity to maximize range and trip completion comfort with the LR/aero combo.

Anyways sorry thread hijack, my apologies. Just really exited by ForeverFree's excellent real world feedback on what an M3 is like. Has been some of the most helpful info I have received.


Numbers at the end of our weekend:

Tried to run the battery down close to zero (to recalibrate range miles). Failed.

Trip up to Mt. Waterman, plus two trips out to Ventura County = 254 miles. Throw in 6 more of vampire (overnight idle/sleep) loss, and you're at 260.

Range display still finished in the yellow, not the red. Showed 41 RM left. Total of 260 + 41 = 301 was mighty close to the 309 which showed after range charge.

Overall usage rate was 244 Wh/mi, just a tad over the 237-ish which yields actual miles equal to range miles.

Driving was largely freeway, with about 70 miles of mountain highway and a few miles of surface streets. Fairly even split between my spirited driving (74 on freeways, with on-ramp enthusiasm) and my wife's mellower style (typically 65 - 72 on freeways).

Pretty impressive all told. Suggests that Tesla may have indeed "used" some of the 335 --> 310 EPA down-rate to boost the "RM break-even" figure to a real-world-doable 237 ... in other words to make displayed range more conservative, more realistic, and more achievable.

P.S. Recalibration did yield slightly higher displayed range: 219 at her standard 70% charge -- implies --> 312 @ 100%.
Nice data, now we need someone with 19” wheels to post some numbers so we can compare.
 
That is what I wish every manufacturer would do. Make it easier to achieve the rated range even in not so ideal conditions, so that you are more than comfortable that you will get the range that is shown without hypermiling.
Not going to happen. Every other manufacturer just wants the best marketing spec. Only Tesla is ballsy and confident enough to leave marketable miles on the table in the interest of something bigger. If the segment was competitive at all, this would never happen IMO
 
  • Like
Reactions: Tdave