Welcome to Tesla Motors Club
Discuss Tesla's Model S, Model 3, Model X, Model Y, Cybertruck, Roadster and More.
Register

Tesla, TSLA & the Investment World: the Perpetual Investors' Roundtable

This site may earn commission on affiliate links.
64% range on my 2018 310 mile car would be only 200 mile. Mine is at 270. Our p3d from 2022 after 2 years is at 280 mile epa.

These numbers look much worse than my experience
Best source is Tesla, much better than some third party collecting data who know how, and with a lot of uncertainty due to BMS calibration, so reporting range displayed is a really bad metric to gauge degradation because it takes into account usage pattern

1716825543418.png
 
64% range on my 2018 310 mile car would be only 200 mile. Mine is at 270. Our p3d from 2022 after 2 years is at 280 mile epa.

These numbers look much worse than my experience

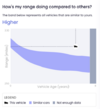
You'll notice the cars started around 70-72% of epa range.

I haven't read in detail, but I assume they are using their own driving cycle (not the EPA cycle) to come up with a range figure...and their cycle happens to be less efficient (I assume more high speed driving etc. than EPA tests).

So, after about 1500 days, dropping from 72 to 64% would be a drop of about 8/72 = 1/9 = about 11%.

Losing 11% of your 310 mile car would put it in the 270-275 mile ballpark, which seems to match your results close enough. I'd imagine if you drove your car on whatever cycle this study used, 200 miles-ish would be a realistic estimate.

So, this study has resulted in some misleading headlines...but I wouldn't blame the study for click-bait journalists being click baity.

Side note: if this was actual degradation to 64% after 5 years being normal, Tesla's 8 year/70% warranty would be covering a lot more battery replacements than anybody has ever heard of.
 
Last edited:
You'll notice the cars started around 70-72% of epa range.

I haven't read in detail, but I assume they are using their own driving cycle (not the EPA cycle) to come up with a range figure...and their cycle happens to be less efficient (I assume more high speed driving etc. than EPA tests).

So, after about 1500 days, dropping from 72 to 64% would be a drop of about 8/72 = 1/9 = about 11%.

Losing 11% of your 310 mile car would put it in the 270-275 mile ballpark, which seems to match your results close enough. I'd imagine if you drove your car on whatever cycle this study used, 200 miles-ish would be a realistic estimate.

So, this study has resulted in some misleading headlines...but I wouldn't blame the study for click-bait journalists being click baity.

Side note: if this was actual degradation to 64% after 5 years being normal, Tesla's 8 year/70% warranty would be covering a lot more battery replacements than anybody has ever heard of.
They just wanted a chart which had “64%” on it. That number means all the FUD may be correct, whereas 8% means tesla, and evs in general, are not having battery degradation enough to worry about. My 2015 egolf is bang on 9% and only 9% off as to any used car is exactly what all cars have always done.
 
Excellent link- thank you for posting it here... I'd recommend everyone read it as it goes into a fair bit of detail on both history and present practice of the court- including pointing out 2 things debunking some recent claims-


First it points out the rules are reviewed/updated annually, so 2023 isn't some weird OMG they reviewed the rules after 200 years thing-- and it points out generally those reviews/updates are for clarity or modernization and typically are apolitical and quite moderate. The rules currently under consideration, it notes, are to increase clarity around M&A and just technical clarifications.

Second-as I already mentioned- it points out the Elon case (without saying Elon-just "significant stockholder") is not a new thing at all, not specific to this judge at all--It's been a Thing under the Entire Fairness doctrine for decades.... and both what the concern for a company with a "significant stockholder" and how to avoid running afoul of the rule have likewise been clear for decades-


That's not a new framework. It's not "activist". It's known and established law, and the basis for the courts decision in the Elon comp case.


Again you can certainly dispute specific aspects of the judgement in terms of how well or how poorly Tesla did the things needed to avoid falling under that rule (ie judgement of how independent the board really is--- or how informed the shareholder vote proxy statement was).... and Teslas lawyers are likely to do so on appeal... (and in at least some respects I think have entirely valid points to raise on such an appeal)


But pretending this is some CRAZY WILD WEST ACIVIST JUDGE IGNORING PAST RULINGS just ain't so, and nobody has provided a shred of evidence for such a claim.


The link also has a quite nice compare/contrast of DE vs TX that's worth reading too... Some good (officers, not just directors have a fiduciary duty in TX for example)...and some bad (Texas business courts will allow jury trials in some cases for example)...and some unknown (the court has basically no prior case law to go on vs generations of it in DE for example)

Well worth reading the whole thing.


All that said- sounds like some folks are getting sick of the topic here, so reminder this exists and might be a better place to take follow-ups:


We may all be exhausted by this issue. One bit of non-revisionist insight is the New York Times in 2018. It's been quoted before but many of us keep forgetting how we felt then:
 
This is another misleading presentation of community data. Our cars are on recurrent. The averages presented in these graphs are the "real range" estimated using their own algorhythm based on the community data. The averages are expressed in % of EPA range but clearly do not represent loss from the EPA numbers. For individual cars they do estimates of EPA ranges specific to that car so one can see the degradation in one's own car. Our two LR RWD model 3's show much less degradation than the community numbers. At 6 years of age and 45 and 58k miles recurrent shows them with ranges substantially above the community averages at 304 and 292 miles. The higher mileage car has been on a number of longer road trips and has been charged above 90% and below 20% on some of those trips. The other car which is shown in the attached fig from recurrent is mostly used for local trips (fwy up to 100 miles rt, but kept between 30 and 80%).

To me this makes it clear that different owners treat the cars differently. The charging history is one important variable while the mileage is another.
Recurrent ignores the mileage and focuses on the age. Then they present summary data. I would assume that they are reasonable representations of their data, but question how they have averaged the data and presented it with respect to vehicle age.

The whole approach of presenting averaged data is always fraught with opportunities for misleading readers.
 

Attachments

  • Screenshot 2024-05-27 at 12.29.40 PM.png
    Screenshot 2024-05-27 at 12.29.40 PM.png
    42.3 KB · Views: 5

Some great info in this report:

View attachment 1051061View attachment 1051062

This plot makes zero sense. Plotting against the battery age in days means nothing if you don´t know how much the car is driven every day. Most likely the car is also driven different distances every day so the data is even distorted. Next, this is only from one car obviously (looking at the strange up and downs which would go away if they really did average the data as they try to make you believe) so too little statistics... Just an awful graph.

This is what crowd-source data says (you can change the car model on the web site; note x-axis is kilometers not miles):

Screenshot 2024-05-27 at 22.29.20.png


Basically 10% down for the first 100k miles which is compatible with the data from Tesla posted above. Proably another 5% for the second 100k mi, but not enough data in this plot to be sure.
 
BTW got the spring update 2024.14.8 on my 2019 Model 3 yesterday and really happy with it, especially the wipers now work as they should :). Also love the new visualizations where you can see all the pedestrians and cars the system sees and brake lights and blinkers. Talking about blinkers, also like the new auto blinkers that turn of automagically after completing a turn or lane change! New trip progress bar is nice, too. Only the new regen bar is hardly visible any more, was better before.
 

Some great info in this report:

View attachment 1051061View attachment 1051062
These graphs don’t make any sense. My 2 year old model Y that has 27,000 miles shows an EPA range of 329 (Out of 330 when new) when I charge it to 100%.
 
BTW got the spring update 2024.14.8 on my 2019 Model 3 yesterday and really happy with it, especially the wipers now work as they should :). Also love the new visualizations where you can see all the pedestrians and cars the system sees and brake lights and blinkers. Talking about blinkers, also like the new auto blinkers that turn of automagically after completing a turn or lane change! New trip progress bar is nice, too. Only the new regen bar is hardly visible any more, was better before.
I'm liking the update too. We now have speed camera detection built in to navigation in the UK, and something I'd not seen before is average speed camera detection where it autosums your average speed in real time while letting you know when the end of the average speed camera zone is so you know if you are staying below it. First time I've seen anything like it, but I haven't used 3rd party speed camera apps in the past.
 
Yup the average speed thing is absolute genius, an excellent addition. I was quite slow to notice brake and indicator lights showing up on all the cars. In general, this was a really nice update. I'm hoping the next one finally gets us in the UK some usability from FSD ownership. Even autopark coming back would be nice. I know true FSD for the UK is held up by idiotic bureaucrats :(
 

"The number of electric vehicles is rising across the UK with reports suggesting that at the end of March, there were 1,000,000 fully electric cars on British roads.

The car leasing experts at Xcite Car Leasing has assessed data from the UK government’s agency, the DVLA. The results of this analysis have been passed onto Digital Journal.

The objective was to find out where in the UK had the most EV uptake out of 1,454 towns and cities, and what cars those across the country were purchasing in those areas.

The EV Hotspot data shows that Tesla comes out on top as the overall most-driven EV brand in the UK with 187,251 cars on the road, which is no surprise given the dominance of the brand worldwide with the likes of the Model Y and Model S. "

and...

Screenshot 2024-05-27 at 3.13.56 PM.png
 
Folks,
Unfortunately due to the prolonged dip in TSLA that is being supported to 58% or higher percentage of selling tagged to shorts for over three weeks, FUDsters are very plentiful on this investing site right now. In case you forgot, FUD stands for:
* FEAR
* UJNCERTAINTY
* DOUBT
Those individuals who are regularly posting questionable material that leads to fear, uncertainty, and doubt in TSLA investors aren't going to disappear until TSLA takes a material climb higher or the uncertainty of the annual meeting's vote is resolved. In the meantime, look for factual information on Tesla's performance. Sometimes a good member makes an error with a post, but the usual suspects leave little doubt about why they're here.
Almost every long-term TSLA investor is experiencing Fear Doubt and Uncertainty while many other stocks and indexes are hitting ATH. Any investor experiencing these feelings when their largest holding is down 58% is human, not some sort of cult of conspiracy funded by the shorts.
 
Almost every long-term TSLA investor is experiencing Fear Doubt and Uncertainty while many other stocks and indexes are hitting ATH. Any investor experiencing these feelings when their largest holding is down 58% is human, not some sort of cult of conspiracy funded by the shorts.

Honestly - I think its an easy path to $2T market cap at this point with a 7-8x multiple on P/S because one is assuming $250B in annualized revenue (which they're at $100B already with multiple gigafactories and megafactories to go).

So, $650 / share is a peace of cake IMO, its a matter of when. Now, $1000? $2000? I have no idea.
 
I mean, you could go further and include software services sales like Track Mode, FSD, etc. on the current fleet and future fleet too. One could assume a 10x+ multiple on P/S if software margins reach 30%+ which is typical of a SW tech company.
 
Here's TSLA's P/S and Market Cap over recent quarters.

Source: https://finance.yahoo.com/quote/TSLA/key-statistics

Screenshot 2024-05-27 at 4.20.17 PM.png


With everything they're accomplishing in FSD, Robotics, Autobidder, etc...

Some P/S Ratios (most recent):

MSFT: 13.58
GOOG: 7.01
AAPL: 7.78
AMZN: 3.23
NVDA: 33.28
META: 8.83
NFLX: 8.23
RIVN: 2.01

It was the Q1 terrorist attacks that are really screwing up TSLA. Nothing else, IMO. This should be a 10x+ P/S ratio company, if not more.

Edit: To add, when BTC ramped up in 2017...there was huge corresponding blockchain usage ramp-up in tech companies applying the tech stack between 2015-2016. What's going on in TSLA R&D is beyond that and they don't have widespread industry adoption yet. Once there is, I wouldn't be surprised of another TSLA ramp re-evaluating the company.
 
Folks,
Unfortunately due to the prolonged dip in TSLA that is being supported to 58% or higher percentage of selling tagged to shorts for over three weeks, FUDsters are very plentiful on this investing site right now. In case you forgot, FUD stands for:
* FEAR
* UJNCERTAINTY
* DOUBT
Those individuals who are regularly posting questionable material that leads to fear, uncertainty, and doubt in TSLA investors aren't going to disappear until TSLA takes a material climb higher or the uncertainty of the annual meeting's vote is resolved. In the meantime, look for factual information on Tesla's performance. Sometimes a good member makes an error with a post, but the usual suspects leave little doubt about why they're here.
Interesting because I’ve seriously been contemplating selling everything lately. My net worth is getting uncomfortably low and the FUD is working on me. Not the first time of course. I’m pretty good at selling at the bottom.
 
There's going to be another stop on the Vegas Loop opening up soon. The tunnels are getting prettyyyyy close to the airport now.


FWIW that's more of a short stub, unconnected to the rest of the current system presently, though planning to be continued north and eventually meet up with it in the future-


More discussion/maps/etc on this here: