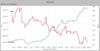
It has been interesting to watch short interest drop over the past 8 months or so as the share price has increased, so I decided to run a chart comparing SP to short interest (by percent of float) to see if this was an aberration or the norm.
From the chart below it seems clear that sell low, buy high has been the short sellers' pattern over the years, at least for the major price moves. Short interest was at a historic high of about 62% of float in November 2012 when SP was ~$30, and it dropped in half to around 30% as the SP ran upward through $100 in 2013. By late 2013, shorts had piled in again with short interest reaching nearly 50% as the SP dipped from $180 to $120. Then shorts bought/covered as the SP rose again up to ~$280 in late 2014. Short interest then stayed on the low side for a while as prices stayed relatively high until shorts again sold the dip down to ~$150 in early 2016. Shorts then covered again as the SP rose and sold short into the dip yet again in late 2016, before buying the recent rise into the $300s.
There have been some exceptions on some of the smaller price moves but it appears that the strong tendency of shorts has been to short sell when prices have been low and cover when prices are high -- which is exactly backwards.
This suggests that on average shorts are engaging in very costly herd behavior -- diving in as the SP drops and then covering (or being forced to cover by margin calls) as the price rises. So on average their returns are likely to be much worse than would be predicted just by looking at changes in the share price (which would be awful to begin with).
Based on the chart, it is tempting to conclude that shorts are being overly influenced by FUD and/or engaging in momentum investing based on perceived weakness in the SP, and are getting crushed in the process. This sell low, buy high pattern is exactly what you would expect from investors acting on emotions rather than facts and cold, hard analysis.
Also, the chart suggests that, as basic laws of supply and demand would predict, increased short interest appears to be correlated with depressed SPs, leading to buying opportunities. Short interest currently is low compared to historic TSLA numbers but very high compared to market norms. This high short interest tends to artificially depress the SP, even leaving aside the FUD and market manipulations that come along with it.
In the long run, I personally believe shorts will be forced to exit which will tend to provide upward pressure on the SP. But it is unclear how long that will take even if Tesla executes well through the Model 3 launch, etc.
It is also possible that if Tesla encounters problems with Model 3 launch, macro difficulties, etc. shorts will pile back in again as the SP drops, which will probably at least temporarily exaggerate any downward price movements, just as short covering should tend to add fuel to strong upward price movements.
View attachment 236108