He is only targeting for 10% upside from here though, $350ish.CNBC After-Hours July 10: Here's why the man who called Tesla's fall is changing his tune


Welcome to Tesla Motors Club
Discuss Tesla's Model S, Model 3, Model X, Model Y, Cybertruck, Roadster and More.
Register
Install the app
How to install the app on iOS
You can install our site as a web app on your iOS device by utilizing the Add to Home Screen feature in Safari. Please see this thread for more details on this.
Note: This feature may not be available in some browsers.
-
Want to remove ads? Register an account and login to see fewer ads, and become a Supporting Member to remove almost all ads.
You are using an out of date browser. It may not display this or other websites correctly.
You should upgrade or use an alternative browser.
You should upgrade or use an alternative browser.
TSLA Technical Analysis
- Thread starter Robert.Boston
- Start date
-
- Tags
- elon is an ass TSLA
He is only targeting for 10% upside from here though, $350ish.
On a technical basis. News can change this.

anyone know where to get raw A/D data, just the daily. Schwab seems to calculate it oddly
it was interesting to watch it from April, 2016 to Nov 30th, then the steady increase to now, with a, if you look at very short term, convex curve, beginning of 7/5/2017 (last wed) then 7/6, 7/7, 7/10 UP, back to wher it was on 6/5
it was interesting to watch it from April, 2016 to Nov 30th, then the steady increase to now, with a, if you look at very short term, convex curve, beginning of 7/5/2017 (last wed) then 7/6, 7/7, 7/10 UP, back to wher it was on 6/5
Today was a confirmation of the bounce that was predicted by the reversal pattern set up from the previous 3 days.
Interesting to note, we closed at 327.18, which is exactly R2 as calculated from the previous day (not including pre- and after- market). As we all know, technicals work very well up until the day they don't!
Also worth noting, this is a complete gap fill of one of the two gaps.
Without mentioning the possibility of lifeless felines, let's just watch and see how far this bounce goes. I think we have further room to run, due to the other gap and the moving averages being a magnet.
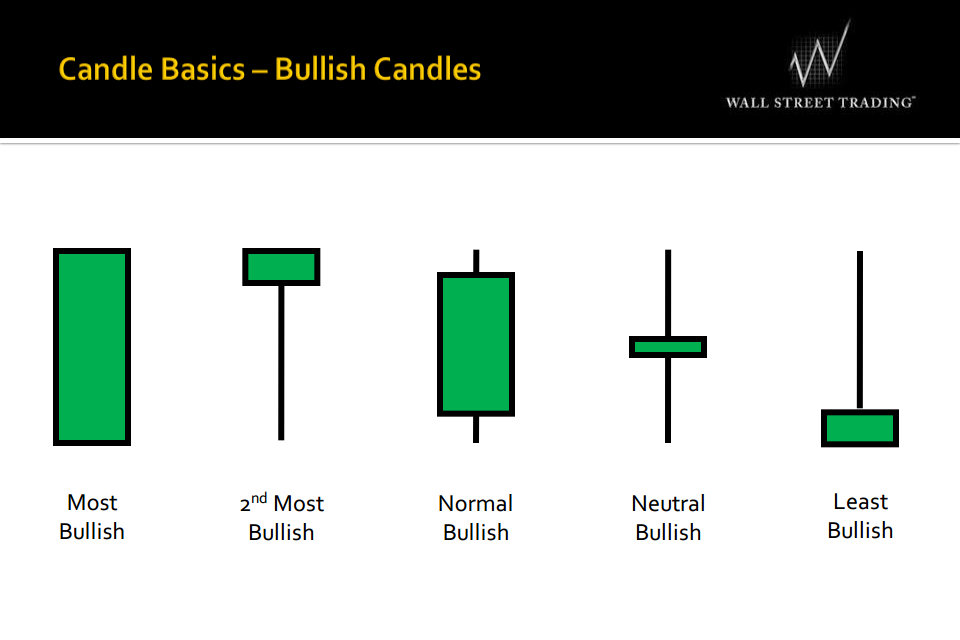
Anyone have further ideas on the meaning of today's candle?
Jonathan Hewitt
Active Member
Definitely very Bullish. Looks mostly like the 1st candle below. Today I was a little concerned that we would fill the first gap and then drop hard. Instead we filled the gap, dropped a little, consolidated, then closed very strong. I would agree with you that chances of filling the next gap around the $350 area is decent based on action today. Whether we do or not we will see in the coming days.
Today I was a little concerned that we would fill the first gap and then drop hard.
The gap fill and R2 happen to coincide today. I was afraid of a pullback off R2 earlier in the day, and was ready to sell the (rather large) trading position at that point. I sold it when we hesitated around 319 right after open but bought back in shortly after.... and held all day into close. I will continue this bounce play into tomorrow.
The fact we had a strong close rather than making the gap fill early and bouncing off it is a posititive as far as I'm concerned. I think we have further to run.
geneclean55
Active Member
Thought I placed a stop order to buy at 321 this morning, but turned out it was actually a market order. Was pleased to see that it filled at 318 when I double checked later in the day.
Jonathan Hewitt
Active Member
Resistance 2. It's in between R1 and R3.someone want to explain what "R2" is?
It's Mr. D2's first name.someone want to explain what "R2" is?
Jonathan Hewitt
Active Member
Jonathan Hewitt
Active Member
neroden
Model S Owner and Frustrated Tesla Fan
I'm expecting a pin to max pain at 325 tomorrow. Monday is anyone's guess...
someone want to explain what "R2" is?
If you're working with daily candles, trying to predict daily resistance and support levels... start with prior day's high, low and close (I don't include after hours) and do this math:
Pivot point (PP) = (High + Low + Close) / 3
First resistance (R1) = (2 x PP) – Low
First support (S1) = (2 x PP) – High
Second resistance (R2) = PP + (High – Low)
Second support (S2) = PP – (High – Low)
Like like technicals, they are spot on sometimes and totally meaningless other times. I have a spreadsheet I punch prior day's numbers into and it figures out the points... buy points, stop loss, and profit taking around those when daytrading on non-news days sometimes helps. I said sometimes because support and resistance can come from prior such levels, psychological round or otherwise significant numbers, etc. and significant news will always override it all.
I think I will take a break from the short term game for a little bit, really can't read the current and winds at the moment.
bdy0627
Active Member
I'm doing the same, which means the short term may become moderately predictable again
To be continued Monday... but
Please??
Looking at this considering possibilities for Monday and next week... today's candle looks nice and solid, almost no upper wick. Would feel much more bullish if the body was larger and closed above yesterday's red candle.
I'm considering 330 to be significant resistance... One possibility is we bounce around below 330 until major news takes up past that level. However if we go past 330, I think we have room to go higher.
Interesting to see volume tapering off after the big drop. The fact price is relatively stable with volume dropping off is telling me selling pressure is less. On the flip side, shorts do enjoy attacking on lower volume days... yesterday was probably mostly shorts trying to keep an uptrend from forming.
The moving averages crossing has been mentioned.... Cup and handle, with the run up confirmed by passing 330 with strength is possible but I think I will hold my bets back until I see come confirmation of an up trend rather then continued consolidation.
Last edited:
2
22522
Guest
The fact that the closing price was pulled above max pain might say something, as max pain is a motivated destination.
View attachment 235637
Looking at this considering possibilities for Monday and next week... today's candle looks nice and solid, almost no upper wick. Would feel much more bullish if the body was larger and closed above yesterday's red candle.
I'm considering 330 to be significant resistance... One possibility is we bounce around below 330 until major news takes up past that level. However if we go past 330, I think we have room to go higher.
Interesting to see volume tapering off after the big drop. The fact price is relatively stable with volume dropping off is telling me selling pressure is less. On the flip side, shorts do enjoy attacking on lower volume days... yesterday was probably mostly shorts trying to keep an uptrend from forming.
The moving averages crossing has been mentioned.... Cup and handle, with the run up confirmed by passing 330 with strength is possible but I think I will hold my bets back until I see come confirmation of an up trend rather then continued consolidation.
FWIW, the candles are a bullish Piercing Pattern:
Bulkowski's Piercing Pattern
Yes I know the last Bearish Doji went the opposite way, but that's the thing about probability, there's always a chance that the opposite outcome happens. Hence the wise words of waiting for confirmation.
Similar threads
- Replies
- 21
- Views
- 6K
- Replies
- 3
- Views
- 902
- Locked
- Replies
- 0
- Views
- 3K
- Replies
- 23
- Views
- 711