A
recent study by researchers at Carnegie Mellon University found that manufacturing EV motors and batteries
required roughly double as many man-hours as an internal combustion engine — up to 24 hours per machine.
My impression is that the authors try to define a computing model to determine the cost of EV versus ICE which is quite a daunting task.
Some issues are that the data used seem a little bit old and there is no particular EV manufacturer or EV vehicle mentionned.
Note: Your really need to dig several web links to find the original Carnegie Mellon publication which can be downloaded for review:
The transition to electrified vehicles: Evaluating the labor demand of manufacturing conventional versus battery electric vehicle powertrains
Date Written: 04 Jun 2022
Download: https: // papers.ssrn.com/sol3/Delivery.cfm/SSRN_ID4144987_code5279829.pdf
The shift from traditional internal combustion engine vehicles (ICEVs) to electric vehicles (EVs) has raised concerns about displacement of automotive manufactu
papers.ssrn.com

Page 21 - Figure 7:
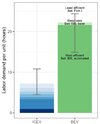
Industry data suggests that BEV powertrain manufacturing will require more labor hours than ICEVs under all expected scenarios.
Note: In the figure, stacked outputs represent labor hours required for manufacturing of the full powertrain.
In the case of the BEV powertrain labor hours estimate, we label the sources of battery data for each scenario on the plot.
The least efficient case assumes the data provided for at-scale manufacturing of batteries by Firm I,
the base case assumes the base case data provided for at-scale manufacturing by IBS,
and the most efficient case assumes the IBS automated estimate.

Page 27 - Figure 8:
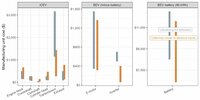
Literature cost estimates of key powertrain components are compared to the production cost outputs
of our PBCM populated with public manufacturing inputs.
The differences between these two data types highlight the uncertainty between estimates,
while the areas of overlap emphasize the similarities in modeling approaches.
Note that the axes are different across each of the panes.
Cost estimates by component (collected from the public literature and visualized in Figure 8).
Page 34 Table 6:
Battery pack [67]
[67] “UBS Evidence Lab Electric Car Teardown—Disruption Ahead,” tech. rep., UBS, 2017.
Inverter [67, 84]
[84] “Acceleration, Drive Cycle Efficiency, and Cost Tradeoffs for Scaled Electric Vehicle Drive System,” IEEE, 2020.
Electric motor, drive [61, 67, 84, 108, 110, 111, 112, 113]
[61] “Evaluation of Electric Vehicle Production and Operating Costs,” Argonne National Lab., IL (US), 1999.
[108] “Techno-economic comparison of series hybrid, plug-in hybrid, fuel cell and regular cars,” Journal of Power Sources, 2010.
[110] “Manufacturing and Cost Analysis for Aluminum and Copper Die Cast Induction Motors for GM’s Powertrain and R&D Divisions,”, MIT 2010.
[111] “Comparing the Mass, Energy, and Cost Effects of Lightweighting in Conventional and Electric Passenger Vehicles,”, 2014.
[112] “The Cost of Manufacturing Electric Vehicle Drivetrains,” University of California, Davis, 1999.
[113] “Electric and Gasoline Vehicle Lifecycle Cost and Energy-Use Model,” University of California, Davis, April 2000.


