JRP3
Hyperactive Member
Extensive testing?Weird that they would have one, or more complete, but not deliver any of them until a big event on December 1st?


You can install our site as a web app on your iOS device by utilizing the Add to Home Screen feature in Safari. Please see this thread for more details on this.
Note: This feature may not be available in some browsers.
Extensive testing?Weird that they would have one, or more complete, but not deliver any of them until a big event on December 1st?
Surprised nobody got $42 yet.Thus far, our crowdsourced forum estimate for Q3 is giving some very interesting and unexpected results, with a range spanning two orders of magnitude.
View attachment 865164
View attachment 865163

The overhang is that EM might sell stock. Once that is out of the way, we don't need to think about Twitter... it has nothing to do with Tesla - unless TSLA bears are able to connect the two with fictional FUD.TWTR overhang not going away for a long time IMHO. Just a different kind of TWTR overhang.
Thus far, our crowdsourced forum estimate for Q3 is giving some very interesting and unexpected results, with a range spanning two orders of magnitude
It passes the time in between FUD articles and totally off-topic rant posts. And it's cheaper than watching Netflix.It would seem that most people here subscribe to the idea that true value generation comes from holding TSLA long. Therefore it's surprising to me how much of the content in this thread tracks the intraday minutiae of the stock. I could use just the posts here to draw a detailed 1D chart for TSLA, even the off-hours stuff.

It’s being reported over in the battery thread that Troy Teslike is saying that 4680 production is shut down. Equipment supplier not able to deliver, and Tesla taking over themselves. Sounds similar to the 3 ramp.
")

The options set up for this week is juicy
Something I've been pondering for the last few days, and hopefully will provide some optimism here going into earnings, is the options setup this week. This weeks expiration is a monthly options expiration, and there is a fairly large amount of open interest. That alone isn't interesting, but where the open interest is *is* interesting.
A feature of the bull market for TSLA from 2019 - 2021 really was heavy call options being bought, causing lots of upside squeezes. And while I don't have a historical record of this, I'd wager earnings weeks would typically have lots of in, or near the money calls being held (expecting a beat) that would get closed after earnings. That overwhelming call buying has faded substantially, and going into this earnings it's very heavily put skewed.
As a very brief refresher, when most anyone buys (or sells, for that matter) an option, they are buying from a dealer/MM/bad guy. The dealer/MM/bad guy generally wants to stay neutral and themselves will buy or sell shares of the underlying stock to hedge appropriately. This amount is effectively represented by the "delta" of the option. The furthest out of the money options have a delta near 0, and once they go in the money (ITM) that delta is 1. So in an example where some loser buys $150 puts, they might have a delta of 0.2, meaning the dealer will short roughly 20 shares (relative to the 100 shares the put contract represents).
The point of all of that is to say, ITM options are basically fully hedged, meaning each ITM put contract carries 100 shorted shares by the dealer with it. (the reverse being true of calls, obviously).
Using open interest from this morning (representing yesterdays data) and yesterdays closing price to match, for options expiring this week there are:
~340k open put contracts ITM (34m shares short)
~66k open call contracts ITM (6.6m shares long)
The general takeaway here is that dealers/MMs/bad guys are net short ~27m shares just by this weeks OpEx. While ~1% of the float may not sound like a lot, in my opinion it is substantial for one week. I know the board likes to suggest that they'll just manipulate it or whatever, what really matters for how this plays out is the behavior of the holders of those puts.
If someone holding a put closes it out, the dealer/MM/bad guy will basically immediately buy back those shares that they shorted to hedge. The only scenario where the net short # of shares stays as is, would be if all those ITM puts basically exercise the position and take out an actual short. Which I doubt, but is possible. Even if someone closes out an in the money put and rolls their position forward they'd likely do it to a lower, out of the money price, which would have a lower delta, meaning less shares short needed to hedge.
What does this all mean?
I think any slight beat is going to send us ripping into early next week. A beat sending the stock up just a little will lead to ITM puts going OTM, lower delta, reducing the shares needed to short to hedge. Some put holders seeing a rising stock price, and their gains slipping away will close out positions, leading to shares sold short being bought back, this should further accelerate a move upwards. Add in some opportunistic degen call buying like the days of old to help juice things further and we've got a squeeze.
But maybe a more important takeaway is I find it hard to see us head materially down from here even if earnings aren't great simply because of this positioning being at least somewhat unwound. And I think this feeling of "we dump after every beat" comes from the opposite of this scenario typically playing out, with traditionally lots of ITM or near the money *calls* being held relative to puts. With holders closing those out after earnings.
Caveats
- I can make mistakes. I've looked at these numbers and I can't read it any other way, but there is always the chance I messed up some logic.
- I simplified the math by only looking at ITM options. All options, regardless of their strike relative to the current price have some delta, and therefore some amount of shares bought/sold short to hedge, but looking at OTM strikes too doesn't meaningfully change the picture to my eye. (but makes the math way more complicated)
- Open interest changes daily, this was as of this morning, but the picture could look a lot different tomorrow.
Lastly @generalenthu I know you often tracked deltas/open interest. Do you have numbers for this expiration? Do you see what I see?
Thank goodness....for a while there i thought Tesla was genuinely losing market share
View attachment 865169
Tesla Captured 65% of US EV Market Through 8 Months of 2022, 21% of Premium/Luxury Segment in Q3
Tesla captured 65% of the U.S. EV market in eight months in 2022. The brand also captured 21% of the premium/luxury segment in Q3, leaving its closest competitor BMW in the dust.www.tesmanian.com
This is a totally fair point, and I can't refute it in any way. I'd just say I wouldn't use the options thread as representative of overall behavior. But even if we assumed the net short # of shares was half that, it's still a substantial amount of shares to be bought back over a short period of time imo.What if a lot of those puts are part of spreads? Meaning that MMs would really only be short on half of those, and long the other half. If we judge by the selling options thread, put spreads vastly outnumber call spreads.
Very thoughtful and pro-active of you, @Gigapress , thanks!I went ahead and made one so we can have it for this quarter. As long as nobody vandalizes it or accidentally overwrites the numbers then this spreadsheet should work fine.
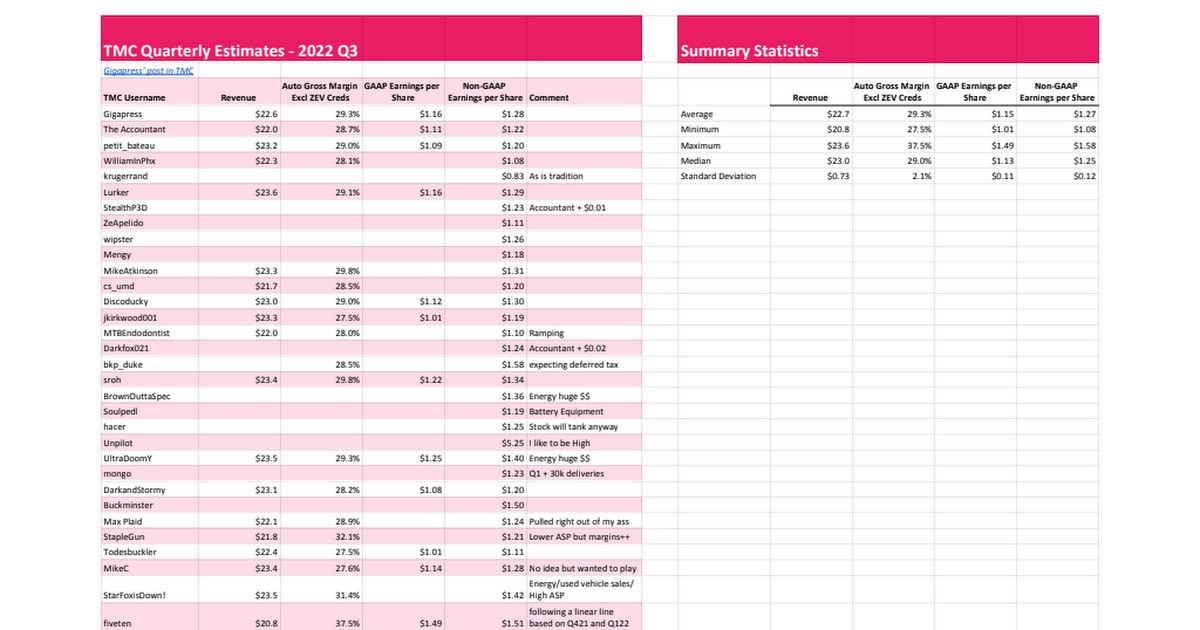
TeslaMotorsClub Investor Casual Quarterly Estimates Compilation
Q3 '22 TMC Quarterly Estimates - 2022 Q3,. .,Summary Statistics <a href="https://teslamotorsclub.com/tmc/posts/7122581/">Gigapress' post in TMC</a> TMC Username,Revenue,Auto Gross Margin Excl ZEV Creds,GAAP Earnings per Share,Non-GAAP Earnings per Share,Comment,Revenue,Auto Gross Margin Excl ZEV...docs.google.com
I got you...was that GAAP or non-GAAP?
I was thinking the same. Lots of Puts sold because of current fear in the market. As soon as earnings are solid, many Puts will be closed and the MM can rebuy the shares they had sold to hedge, which causes the SP to rise and more Puts to be closed, etc.The options set up for this week is juicy
Something I've been pondering for the last few days, and hopefully will provide some optimism here going into earnings, is the options setup this week. This weeks expiration is a monthly options expiration, and there is a fairly large amount of open interest. That alone isn't interesting, but where the open interest is *is* interesting.
A feature of the bull market for TSLA from 2019 - 2021 really was heavy call options being bought, causing lots of upside squeezes. And while I don't have a historical record of this, I'd wager earnings weeks would typically have lots of in, or near the money calls being held (expecting a beat) that would get closed after earnings. That overwhelming call buying has faded substantially, and going into this earnings it's very heavily put skewed.
As a very brief refresher, when most anyone buys (or sells, for that matter) an option, they are buying from a dealer/MM/bad guy. The dealer/MM/bad guy generally wants to stay neutral and themselves will buy or sell shares of the underlying stock to hedge appropriately. This amount is effectively represented by the "delta" of the option. The furthest out of the money options have a delta near 0, and once they go in the money (ITM) that delta is 1. So in an example where some loser buys $150 puts, they might have a delta of 0.2, meaning the dealer will short roughly 20 shares (relative to the 100 shares the put contract represents).
The point of all of that is to say, ITM options are basically fully hedged, meaning each ITM put contract carries 100 shorted shares by the dealer with it. (the reverse being true of calls, obviously).
Using open interest from this morning (representing yesterdays data) and yesterdays closing price to match, for options expiring this week there are:
~340k open put contracts ITM (34m shares short)
~66k open call contracts ITM (6.6m shares long)
The general takeaway here is that dealers/MMs/bad guys are net short ~27m shares just by this weeks OpEx. While ~1% of the float may not sound like a lot, in my opinion it is substantial for one week. I know the board likes to suggest that they'll just manipulate it or whatever, what really matters for how this plays out is the behavior of the holders of those puts.
If someone holding a put closes it out, the dealer/MM/bad guy will basically immediately buy back those shares that they shorted to hedge. The only scenario where the net short # of shares stays as is, would be if all those ITM puts basically exercise the position and take out an actual short. Which I doubt, but is possible. Even if someone closes out an in the money put and rolls their position forward they'd likely do it to a lower, out of the money price, which would have a lower delta, meaning less shares short needed to hedge.
What does this all mean?
I think any slight beat is going to send us ripping into early next week. A beat sending the stock up just a little will lead to ITM puts going OTM, lower delta, reducing the shares needed to short to hedge. Some put holders seeing a rising stock price, and their gains slipping away will close out positions, leading to shares sold short being bought back, this should further accelerate a move upwards. Add in some opportunistic degen call buying like the days of old to help juice things further and we've got a squeeze.
But maybe a more important takeaway is I find it hard to see us head materially down from here even if earnings aren't great simply because of this positioning being at least somewhat unwound. And I think this feeling of "we dump after every beat" comes from the opposite of this scenario typically playing out, with traditionally lots of ITM or near the money *calls* being held relative to puts. With holders closing those out after earnings.
Caveats
- I can make mistakes. I've looked at these numbers and I can't read it any other way, but there is always the chance I messed up some logic.
- I simplified the math by only looking at ITM options. All options, regardless of their strike relative to the current price have some delta, and therefore some amount of shares bought/sold short to hedge, but looking at OTM strikes too doesn't meaningfully change the picture to my eye. (but makes the math way more complicated)
- Open interest changes daily, this was as of this morning, but the picture could look a lot different tomorrow.
Lastly @generalenthu I know you often tracked deltas/open interest. Do you have numbers for this expiration? Do you see what I see?
Or if those put buyers are just wary that the macro is turning around (or just a bear rally).I was thinking the same. Lots of Puts sold because of current fear in the market. As soon as earnings are solid, many Puts will be closed and the MM can rebuy the shares they had sold to hedge, which causes the SP to rise and more Puts to be closed, etc.
Talking Point: As Tesla scales to higher volumes margins will approach normal auto industry margins.
Even matching what Tesla is doing in all of the areas above isn't an easy task for any other carmaker, even if it was a static target.Tesla aims to be the best at manufacturing - bar none.
Awesome - thanks for doing this.I went ahead and made one so we can have it for this quarter. As long as nobody vandalizes it or accidentally overwrites the numbers then this spreadsheet should work fine.
TeslaMotorsClub Investor Casual Quarterly Estimates Compilation
Q3 '22 TMC Quarterly Estimates - 2022 Q3,. .,Summary Statistics <a href="https://teslamotorsclub.com/tmc/posts/7122581/">Gigapress' post in TMC</a> TMC Username,Revenue,Auto Gross Margin Excl ZEV Creds,GAAP Earnings per Share,Non-GAAP Earnings per Share,Comment,Revenue,Auto Gross Margin Excl ZEV...
I got you...was that GAAP or non-GAAP?
Yes - I gave my chart to someone on Twitter who posted it.Wow, your SS was just posted on Twitter... and Teslike liked it!
