


Welcome to Tesla Motors Club
Discuss Tesla's Model S, Model 3, Model X, Model Y, Cybertruck, Roadster and More.
Register
Install the app
How to install the app on iOS
You can install our site as a web app on your iOS device by utilizing the Add to Home Screen feature in Safari. Please see this thread for more details on this.
Note: This feature may not be available in some browsers.
-
Want to remove ads? Register an account and login to see fewer ads, and become a Supporting Member to remove almost all ads.
You are using an out of date browser. It may not display this or other websites correctly.
You should upgrade or use an alternative browser.
You should upgrade or use an alternative browser.
TSLA Technical Analysis
- Thread starter Robert.Boston
- Start date
-
- Tags
- TSLA
Pretty classic looking bullish engulfing pattern signifying bottom of downtrend maybe?
I was thinking the same thing....

Hammer and engulfing pattern.... also bouncing off the lower BB.
Last edited:
The TSLA share price today appears in the process of attempting to fill the big gap created between the $272.60 low of February 22 and the $264.66 high of February 23. Completely filling that gap could be seen as a strongly positive technical signal.
Last edited:
If macro is good tomorrow, and I suspect Trump-mania runs tomorrow still, and we end up 1-2% one could say this looks like a "V". Maybe we just retake 270 in short order.
In a month, just like I said

Note the monthly chart continues to look lovely. The Bollinger band range here is super instructive. It is literally the statistical range we have been in for 3 years. We are snuggled up against the top of it. We broke above it briefly last month and retreated a bit. But this ultra-quick recovery is new. As @luvb2b said (reverse plagiarizing now) in his great post Usually when we flirt with the dreaded 280's we get slapped down for months. Now we are retesting it really quickly. Smells like a break out.
And as Trend trader likes to point out, the MACD has gone positive for essentially the first time (first time going from neg to positive)Bonus 3 era chart
(I am aware I posted that I could see scenarios where the stock price did not go into it's new "era" until mid 2018. But that is a bearish corner case.)
Chart pro tip: I make headroom on this chart by forcing it to plot AMZN price in an invisible color.
neroden
Model S Owner and Frustrated Tesla Fan
I've often noticed that when stocks (or other tradable assets) go on bull runs, they will usually trade between a rising 5-period moving average and the upper Bollinger Band. Sometimes we see a dip to the 10-period moving average.
We see this quite clearly over the 3 bull runs of 2013-2015 on the weekly. Especially during the first wave:

Looking at the daily chart, this pattern appears again during the bull run from Dec 16 until mid-Feb 17. The question then is whether we are beginning a second bull run. We'll be able to say this with more conviction IMO, if we see price finding support at the 5-DMA in the next few days. We are also at what is potentially an important juncture (ATH, breaking out of a range etc), so just as the beginning of the big 2013-2015 run was marked by price trading above the upper BB - an indication of strong demand, I'd also like to see price do the same now on the daily, as it did 3 and 4 days ago:

We see this quite clearly over the 3 bull runs of 2013-2015 on the weekly. Especially during the first wave:
Looking at the daily chart, this pattern appears again during the bull run from Dec 16 until mid-Feb 17. The question then is whether we are beginning a second bull run. We'll be able to say this with more conviction IMO, if we see price finding support at the 5-DMA in the next few days. We are also at what is potentially an important juncture (ATH, breaking out of a range etc), so just as the beginning of the big 2013-2015 run was marked by price trading above the upper BB - an indication of strong demand, I'd also like to see price do the same now on the daily, as it did 3 and 4 days ago:
Last edited:
The monthly chart is beginning the month outside the upper BB - an indication of strong demand. The Bands are widening to give the stock 'room' to run up. There's also more space between the blue MACD line and the red signal line, which gives more conviction to the cross:

The weekly has left the 5-WMA and is being drawn to the upper BB at $301:

The daily is still caught between the 5-DMA and the upper BB, with apparent support at the 5-DMA. Exactly how it should be trading if we are embarking on another bull run:

Williams%R is pink/overbought on all three timeframes indicating strong demand. Looks like we are finally going to break out of this 2-year range. Everything looks so bullish it almost seems too good to be true! Not much more to add here.
The weekly has left the 5-WMA and is being drawn to the upper BB at $301:
The daily is still caught between the 5-DMA and the upper BB, with apparent support at the 5-DMA. Exactly how it should be trading if we are embarking on another bull run:
Williams%R is pink/overbought on all three timeframes indicating strong demand. Looks like we are finally going to break out of this 2-year range. Everything looks so bullish it almost seems too good to be true! Not much more to add here.
Jonathan Hewitt
Active Member
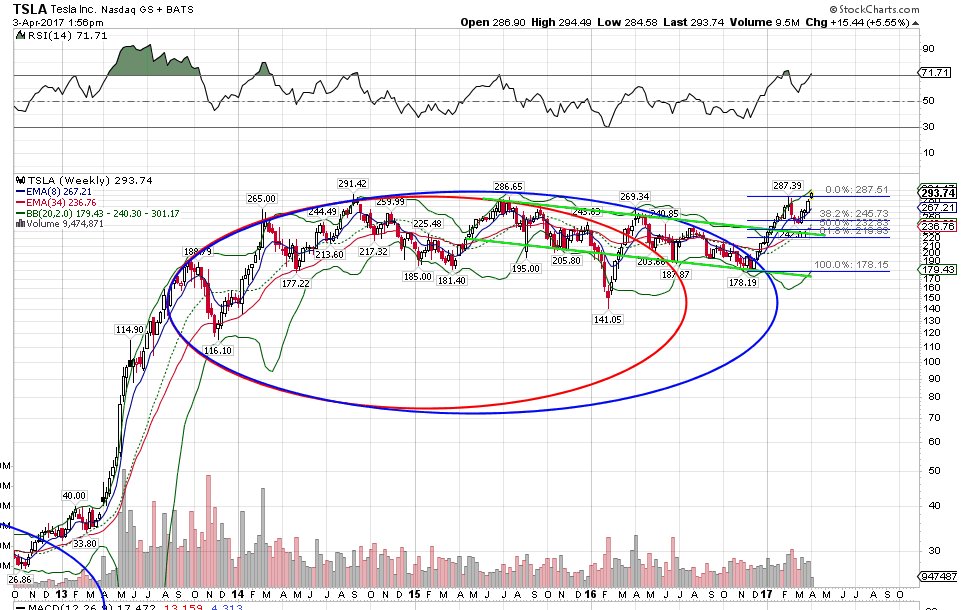
Taken from Twitter.
Nobuaki on Twitter
It's basically what all the other technicals are telling us.
1. We have a breakout from a several year consolidation period.
2. This breakout is similar to the one in 2013 (You can see part of the oval that fit the ~2010-2013 consolidation period in the bottom left)
It certainly looks like it! That said, the market always seems to love screwing with investors' heads, so I wouldn't be surprised if we pull back into the range and get people thinking "false breakout" only to rally again from there. Seems that will depend on the market as a whole and news on M3 production ramp during the upcoming earnings call. Here's the daily (extended hours). Support still holding on the 5day SMA:We have a breakout from a several year consolidation period.

neroden
Model S Owner and Frustrated Tesla Fan
News always trumps technicals.
Obviously, any real bad news about Model 3, or an unexpected negative earnings surprise, could send the stock into a (temporary) power dive. I can't quite imagine what an unexpected negative earnings surprise would be given how low analysts' expectations actually are, so I figure basically bad news about Model 3 is the most likely thing to cause a dip. And honestly... I don't think that's likely. Musk is targeting July, but I think *everyone* is assuming September or later, so if he manages to get it out by August it'll be a *positive* surprise.
Obviously, any real bad news about Model 3, or an unexpected negative earnings surprise, could send the stock into a (temporary) power dive. I can't quite imagine what an unexpected negative earnings surprise would be given how low analysts' expectations actually are, so I figure basically bad news about Model 3 is the most likely thing to cause a dip. And honestly... I don't think that's likely. Musk is targeting July, but I think *everyone* is assuming September or later, so if he manages to get it out by August it'll be a *positive* surprise.
geneclean55
Active Member
So, any technical-analysis guys have any thoughts on what we just saw (gap up on Monday morning, flat trading all day)? It means nothing to me...
I think the TA read was interesting trying to predict if a breakout would happen in say Mid March, but now that has happened by any measure. For instance, one could have said we had an Inverse head and shoulders breakout on the weekly:

Otherwise it's just up and to the right on heavy volume. The interesting reads will be if and when we get toppy, but I just don't see it at all.
The monthly is just lovely too, straight up and to the right, but that is just my artistic review. It looks a little like early 2013 before an unexpected profitable quarter was announced...
On the daily we are doing Monday jumps and Tue-Fri consolidation. Doubt that will continue but it is interesting to watch.
Otherwise it's just up and to the right on heavy volume. The interesting reads will be if and when we get toppy, but I just don't see it at all.
If you believe the 3 year trading range is $180 to $280 then the measured move of the breakout is to $380.
geneclean55
Active Member
Anyone else surprised by the way TSLA has been trading since end of November. Clear TA moves, almost text-book, and very little chop.
Anyone else surprised by the way TSLA has been trading since end of November. Clear TA moves, almost text-book, and very little chop.
I was surprised at the SP.
Expected a run up, but didn't think it would top out initially at 280-290. I had calculated 252. Expected a pull back at that point (and was going to get back in some more), but then the SP kept going. Grabbed some more with the pull back from 280 to 240s, and then just before current run-up, but no way near as much as I wanted.
I had invoked the Elliot Waves to claim a run up of SP to 300, but didn't really believe it.. at. the. time. Now I must go finish those books... Also as a candlestick fan, there are lots of bearish patterns that TSLA just ignores in it's current "bull" phase that it would follow to the T in its prior "bear" phase. Bullish patterns now have lots of meaning, which didn't seem to do squat before.
Fascinating.
Onne word: tencent
They are fighting for another 5% with all the shorts and other crazies...
They are fighting for another 5% with all the shorts and other crazies...
Ok, finally did some more reading of Elliot Wave Principle (Frost & Prechter). Here's my take on what we are seeing for TSLA based on the rules, and my reading (I've color coded some of the terms and jargon in this discussion, in a set of colors we all understand):

I've underlined the area in green which I believe is the motive Impulse Waves, from early 2013 to early 2014. I've discounted the IPO period up to the initial run-up**. This pattern follows the rules:
Wave 2 and 4 cannot retrace the prior waves (1&3) 100%. Wave 4 does not overlap wave 1. Wave 3 is not the shortest motive impulse wave. I believe for TSLA there was a wave 5 extension (which proved to be the longest wave).
The correction pattern was a long one. It runs from early 2014 to the trough in Feb 2016. This is a corrective pattern known as an Expanding Triangle. It is a 5 wave correction pattern, not the usual 3. Wave B can exceed the wave 5 peak in this pattern. And Wave E often breaks above or below the trend-line formed by Wave A-C. Please note this is where we got stuck in the past, I believe we were all looking at wave A and thinking it was wave 4, trying to keep a 3 wave corrective pattern.
Thus the first motive wave for our current cycle began in Feb 2016 and peaked April 2016. The slow run down to the trough in Nov/Dec 2016 is Wave 2.
And we are in Wave 3. Wave 4 cannot retrace 100% of wave 3, so SP "cannot" go to 180. And Wave 4 cannot overlap Wave 1, which peaked at around 270. So wave 4 will never be lower than 270 or so. I'm guessing that this time Wave 3 will be longer than wave 1, so at minimum it will be 180 to 310 (wave 1, 140 to 270 = 130). It can be shorter, IF wave 5 is even shorter--recall the rule is that Wave 3 cannot be the shortest wave.
So here's a bit of my incomplete reading of Elliot Waves, and my reinterpretation of the chart. Will add more if my reading changes anything.
**there is a case to be made that this was a separate type of motive waves called Diagonals. In this case it would be a set of Leading Diagonals, and would have included a set of corrective waves prior to the Impulse Wave 1 breakout.
Similar threads
- Replies
- 21
- Views
- 6K
- Replies
- 3
- Views
- 913
- Locked
- Replies
- 0
- Views
- 3K
- Replies
- 23
- Views
- 782