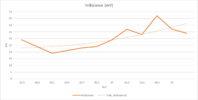
Lowest imbalance is always near the center of the SoC range, because the delta-voltage at those SoCs is much lower vs near the ends of the range. For example, 3.1V to 3.6V (500mV change) might represent 0-20%, but 3.6V to 3.9V (300mV change) might represent 20-80% (not exact figures, just illustrating). So usually what you'll see is an imbalance be exaggerated near either end of the SoC range.
Not sure where the folks get their info from, but the permitted delta is based on a lot of factors and varies substantially. There's no fixed allowed delta anywhere below 100mV, but there can be disallowed deltas as low as 20mV in extreme cases. Generally 60-100mV is where the BMS is likely to be picky.
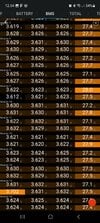
A brick that has a lower voltage at high SoC and higher voltage at low SoC is likely to be a stronger brick. Higher voltage at high SoC and lower voltage at lower SoC, likely a weaker brick.
Again, voltage is only part of the picture. The BMS doesn't really expose a lot of the data needed to paint a better picture of pack health without additional coercion.
Overall, I usually suggest just letting the BMS do its job and not dwell on any particular metric.
Not sure where the folks get their info from, but the permitted delta is based on a lot of factors and varies substantially. There's no fixed allowed delta anywhere below 100mV, but there can be disallowed deltas as low as 20mV in extreme cases. Generally 60-100mV is where the BMS is likely to be picky.
A brick that has a lower voltage at high SoC and higher voltage at low SoC is likely to be a stronger brick. Higher voltage at high SoC and lower voltage at lower SoC, likely a weaker brick.
Again, voltage is only part of the picture. The BMS doesn't really expose a lot of the data needed to paint a better picture of pack health without additional coercion.
Overall, I usually suggest just letting the BMS do its job and not dwell on any particular metric.

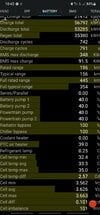
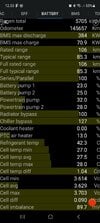
 Passes 100mV cell imbalance often. Lowest I see it is 40mV, often 70s and 80s. Has over 56000kWh charge total, more than 24000kwh DC charging. Jan 2015 pack. My failed pack was a Mar 2015 pack with 30k kWh total charging, 8k kWh DC, usually read about 10-15 mV imbalance, 40mV max I saw sometimes.