Welcome to Tesla Motors Club
Discuss Tesla's Model S, Model 3, Model X, Model Y, Cybertruck, Roadster and More.
Register

National and State Renewable Energy stats

This site may earn commission on affiliate links.
Yes they too would enjoy their power at over 40c per kwh…but easy to beat with some renewables on the roof.
It isn't wholesale energy prices that make South Australia's retail electricity expensive: Quarterly base futures prices.

It's the network and distribution costs that are expensive, because those in Adelaide are cross-subsidising the substantial cost of running poles & wires out to all the remaining sparsely populated bits of the state. Even if the power was generated for free it would still be expensive.
Yes its the poles and wires, specifically the local distribution network by sapn. this distribution cost is expensive because less people are buying power due to household and business solar, so those that are left (with no solar) have to divide up the distribution cost between them. I agree that generation is a small part of any bill in SA. Distant high voltage transmission to the outer regions is by a different company and represents less than 10% of the kwh cost. This is a similar challenge now facing motoring, and those without a renewables car having to each share a larger part of the road maintenance. Like ev’s, expect a sun tax soon.
But generation also contributes as sufficient fossil assets have to be maintained and ready for a wind-less night. That standby cost is divided up across all users. The only way to defeat it is take control yourself with solar and battery, which actually makes it financially worse for everyone else That hasn’t done the same.
 
Last edited:
this distribution cost is expensive because less people are buying power due to household and business solar, so those that are left (with no solar) have to divide up the distribution cost between them... The only way to defeat it is take control yourself with solar and battery, which actually makes it financially worse for everyone else That hasn’t done the same.

Wouldn’t it be more accurate to say “people are buying less power” not “less people are buying power” because the number of people gone truly off-grid would be tiny. There’s still roughly the same number of people paying the grid daily connection charge, but certainly in SA (second highest rooftop solar penetration in the country - 42.4%) a large number of those people are either buying no net power at all (or are net exporters, and their retailer owes them money) or have massively reduced their grid consumption.

So turnover would be collapsing, and that is a problem. I would expect daily connection fees start to increase quite a lot. Merely increasing per kWh charges will just stimulate more and more solar and battery substitution. But if a solar+battery house needs grid power even < 5% of the time, they can‘t disconnect from the grid. Or it is very unlikely they will. So the daily connection fee is the price to have power available at any time, and is much harder to avoid.
Yes agree “people are buying less power”. Daily charges are also increasing significantly, average is now probably around 90c per day. They have tried to slow the solar uptake by decreasing the FIT and threatening disconnects during peak sunlight, but thats just stimulating more batteries.
 
  • Like
Reactions: Hairyman and paulp
Distant high voltage transmission to the outer regions is by a different company and represents less than 10% of the kwh cost.
Yes, the cost isn't high voltage transmission so much as the LV distribution networks out in the regional areas which are long, skinny and therefore expensive. All the states have these to some degree but SA has it the worst (and has only one DNSP covering the whole area).

As distribution costs have to be covered by less kWh consumed it's inevitable that daily charges will take more of the burden.
 
  • Like
Reactions: Vostok
They have tried to slow the solar uptake by decreasing the FIT and threatening disconnects during peak sunlight, but thats just stimulating more batteries.

I doubt the rationale or motivation for decreasing FIT was to try to reduce solar uptake. And it certainly wouldn’t work. People put solar on the roof to avoid 50c/kWh peak charges, not to gain 10 c/kW FIT. Only in the very early days of solar were unsustainable FITs (think 60c/kWh) used to stimulate adoption.

These changes are purely economic - increasingly SA has no-one to sell excess solar to at certain times. So it is becoming an increasingly worthless commodity, and so the market price falls.

Threatening disconnects during peak sunlight is unavoidable for grid management as a result of having nowhere to dump the electricity. Smart inverters should now be mandatory, so that inverters in a given area can be told by the grid operator to dial down to just supply household needs and stop exporting. That is much better than having complete switch off as the only grid management option, because that really cheeses people who have invested in solar.

My FIT is only 5 c/kWh but I am fine with that, I never exported a lot anyway with a small solar array and 2 EVs to fill. Low FIT also buys me a low daily connection charge, which brings me more bang per buck in lowering my grid bill.
 
What on earth? Must journalists keep demonstrating they have precisely zero knowledge of or interest in history? Must every footnote be a world-first? For several decades pre-Basslink, Tasmania was powered entirely by renewable hydroelectric power for far longer than a week.

Well that’s because grids running on 100% hydro or close to it are nothing new and not notable.

However statewide grids running 100% on solar and wind only (no hydro or anything else) are completely new, and currently there is only one example in the world where that has been achieved for non-trivial amounts of time: South Australia.

So yeah, it is a world-first and worthy of coverage (notwithstanding the 2% of mandated generation from gas turbines).
 
Well that’s because grids running on 100% hydro or close to it are nothing new and not notable.

However statewide grids running on 100% solar and wind are completely new, and currently there is only one example in the world where that has been achieved for non-trivial amounts of time: South Australia.

So yeah, it is a world-first and worthy of coverage (notwithstanding the 2% of mandated generation from gas turbines).
the SA Premier stated:

"We understand that it's also a world-first for an entire jurisdiction to have all of its energy needs met across a seven-day period exclusively by renewables,"

It isnt calling out solar or wind, although the article does mention them elsewhere, but generally sticks by the theme of ‘renewables’.
 
"We understand that it's also a world-first for an entire jurisdiction to have all of its energy needs met across a seven-day period exclusively by renewables,"

It isnt calling out solar or wind, although the article does mention them elsewhere, but generally sticks by the theme of ‘renewables’.

Well that’s clearly mis-speaking by the Premier, and his advisor or speechwriter should get a kick up the bum for being sloppy with words. The quote should have been “exclusively by wind and solar renewables”
 
Happy new year everyone!

The stats for December - 42% renewable energy just pips November’s 41.9%. SA hit a new overall record of 86.5%, with new daytime and nighttime records as well.

And extraordinarily NSW has beaten VIC for the first time, with VIC falling below 40% and NSW going over 40% for the first time. When the Liddell coal-fired power station permanently closes in just 4 months’ time, expect NSW renewable percent to jump with less renewable curtailment happening.

Since I’m on holidays, I might produce some interesting trend charts in my spare time…. watch this space!


Renewable energy generation for December - average for the month:
  • National - 42.0%
  • TAS - 99.7%
  • SA - 86.5%
  • WA - 41.0%
  • NSW - 40.4%
  • VIC - 39.2%
  • QLD - 28.4%
Peak renewable generation for December - and time of occurrence:
  • National - 67.0% on 14 Dec 14:00
  • TAS - 100.0% on many occasions
  • SA - 98.2% on 10 Dec 16:15
  • WA - 82.8% on 12 Dec 13:45
  • NSW - 70.8% on 14 Dec 14:00
  • VIC - 67.5% on 04 Dec 11:15
  • QLD - 61.1% on 06 Dec 12:15
Daytime renewable performance for December - renewable percentage when solar production is not zero:
  • National - 45.3%
  • TAS - 99.8%
  • SA - 88.9%
  • WA - 48.1%
  • NSW - 48.0%
  • VIC - 44.3%
  • QLD - 36.3%
Nighttime renewable performance for December - renewable percentage when solar production is zero:
  • National - 26.8%
  • TAS - 99.6%
  • SA - 80.0%
  • VIC - 27.8%
  • WA - 26.7%
  • NSW - 21.1%
  • QLD - 7.6%
Diurnal renewable hardness for December - ratio of nighttime renewable percentage to daytime:
  • National - 0.59
  • TAS - 1.00
  • SA - 0.90
  • VIC - 0.63
  • WA - 0.56
  • NSW - 0.44
  • QLD - 0.21
Small Scale / Rooftop solar as a proportion of all generation for December - invisible to AEMO:
  • National - 15.1%
  • SA - 28.8%
  • WA - 22.1%
  • NSW - 14.5%
  • QLD - 13.6%
  • VIC - 13.0%
  • TAS - 5.3%
Renewable mix for December - solar includes small-scale solar, hydro includes pumped hydro:
  • National - Wind: 31.6%, Solar: 54.8%, Hydro: 13.6%
  • NSW - Wind: 21.1%, Solar: 65.3%, Hydro: 13.6%
  • QLD - Wind: 11.0%, Solar: 84.5%, Hydro: 4.6%
  • SA - Wind: 58.0%, Solar: 42.0%, Hydro: 0.0%
  • TAS - Wind: 17.9%, Solar: 5.3%, Hydro: 76.8%
  • VIC - Wind: 47.0%, Solar: 43.8%, Hydro: 9.2%
  • WA - Wind: 45.8%, Solar: 54.2%, Hydro: 0.0%
SNSWNB Index for December - sun not shining wind not blowing index: total duration in minutes spread across N separate periods:
  • National - 0 minutes across 0 periods
  • NSW - 0 minutes across 0 periods
  • QLD - 0 minutes across 0 periods
  • SA - 0 minutes across 0 periods
  • TAS - 105 minutes across 4 periods
  • VIC - 0 minutes across 0 periods
  • WA - 0 minutes across 0 periods
 
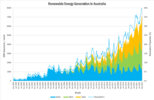
As threatened 😁 here is my first stats dump, looking at the rise of renewables and decline of coal, updating my post from over a year ago. Data from OpenNEM.

The first chart shows growth in renewable generation since 1998.

RenewableGen.png

Notable stats:
  • Grid wind power first appeared in June 2007 and grid solar in March 2015.
  • Renewable generation milestones (first time each TWh per month was reached):
    • 2 TWh - November 2010
    • 3 TWh - August 2013
    • 4 TWh - July 2018
    • 5 TWh - November 2020
    • 6 TWh - December 2021
    • 7 TWh - December 2022
  • Renewable percentage milestones:
    • 10% - September 2010
    • 20% - October 2016
    • 30% - September 2020
    • 40% - November 2022
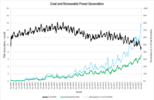
The second chart shows total renewable and coal generation, and renewables as a percentage of coal generation on the right-hand scale:

CoalvRenew.png

Notable stats:
  • As a percentage of all electricity generation, coal peaked at 96.4% in November 1999. Since then it has crossed these milestones:
    • 90% - October 2004
    • 80% - August 2010
    • 70% - September 2013
    • 60% - September 2021
  • Coal's total generation peaked at 16.3 TWh in a month in July 2007
  • Coal went below 10 TWh in a month for the first time in September 2021
  • Coal's smallest contribution was 8.7 TWh in November 2022 - 53.5% of all generation.
  • Renewables as a percentage of coal generation milestones:
    • 30% - October 2016
    • 40% - November 2019
    • 50% - August 2021
    • 60% - October 2021
    • 70% - November 2022
Trending the trajectory forward from 2017, when coal began its terminal decline:
  • Coal will finally produce less than 50% of Australia's electricity some time in 2024 (trend suggests April)
  • We will cross 50% renewables in 2025. But at the rate renewables are growing (and with coal-fired power stations closing this year and next) I think it will happen sooner than that - so I'm sticking my neck out and saying it will happen next year!
 
As threatened 😁 here is my first stats dump, looking at the rise of renewables and decline of coal, updating my post from over a year ago. Data from OpenNEM.

The first chart shows growth in renewable generation since 1998.

View attachment 891351

Notable stats:
  • Grid wind power first appeared in June 2007 and grid solar in March 2015.
  • Renewable generation milestones (first time each TWh per month was reached):
    • 2 TWh - November 2010
    • 3 TWh - August 2013
    • 4 TWh - July 2018
    • 5 TWh - November 2020
    • 6 TWh - December 2021
    • 7 TWh - December 2022
  • Renewable percentage milestones:
    • 10% - September 2010
    • 20% - October 2016
    • 30% - September 2020
    • 40% - November 2022
The second chart shows total renewable and coal generation, and renewables as a percentage of coal generation on the right-hand scale:

View attachment 891353

Notable stats:
  • As a percentage of all electricity generation, coal peaked at 96.4% in November 1999. Since then it has crossed these milestones:
    • 90% - October 2004
    • 80% - August 2010
    • 70% - September 2013
    • 60% - September 2021
  • Coal's total generation peaked at 16.3 TWh in a month in July 2007
  • Coal went below 10 TWh in a month for the first time in September 2021
  • Coal's smallest contribution was 8.7 TWh in November 2022 - 53.5% of all generation.
  • Renewables as a percentage of coal generation milestones:
    • 30% - October 2016
    • 40% - November 2019
    • 50% - August 2021
    • 60% - October 2021
    • 70% - November 2022
Trending the trajectory forward from 2017, when coal began its terminal decline:
  • Coal will finally produce less than 50% of Australia's electricity some time in 2024 (trend suggests April)
  • We will cross 50% renewables in 2025. But at the rate renewables are growing (and with coal-fired power stations closing this year and next) I think it will happen sooner than that - so I'm sticking my neck out and saying it will happen next year!
Great stats Vostok.
 
As threatened 😁 here is my first stats dump, looking at the rise of renewables and decline of coal, updating my post from over a year ago. Data from OpenNEM.

The first chart shows growth in renewable generation since 1998.

View attachment 891351

Notable stats:
  • Grid wind power first appeared in June 2007 and grid solar in March 2015.
  • Renewable generation milestones (first time each TWh per month was reached):
    • 2 TWh - November 2010
    • 3 TWh - August 2013
    • 4 TWh - July 2018
    • 5 TWh - November 2020
    • 6 TWh - December 2021
    • 7 TWh - December 2022
  • Renewable percentage milestones:
    • 10% - September 2010
    • 20% - October 2016
    • 30% - September 2020
    • 40% - November 2022
The second chart shows total renewable and coal generation, and renewables as a percentage of coal generation on the right-hand scale:

View attachment 891353

Notable stats:
  • As a percentage of all electricity generation, coal peaked at 96.4% in November 1999. Since then it has crossed these milestones:
    • 90% - October 2004
    • 80% - August 2010
    • 70% - September 2013
    • 60% - September 2021
  • Coal's total generation peaked at 16.3 TWh in a month in July 2007
  • Coal went below 10 TWh in a month for the first time in September 2021
  • Coal's smallest contribution was 8.7 TWh in November 2022 - 53.5% of all generation.
  • Renewables as a percentage of coal generation milestones:
    • 30% - October 2016
    • 40% - November 2019
    • 50% - August 2021
    • 60% - October 2021
    • 70% - November 2022
Trending the trajectory forward from 2017, when coal began its terminal decline:
  • Coal will finally produce less than 50% of Australia's electricity some time in 2024 (trend suggests April)
  • We will cross 50% renewables in 2025. But at the rate renewables are growing (and with coal-fired power stations closing this year and next) I think it will happen sooner than that - so I'm sticking my neck out and saying it will happen next year!
Thanks for putting in your time to this
 
  • Like
Reactions: Vostok and paulp
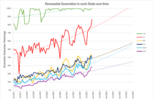
The next stats dump is the "State of Origin" renewables contest! The chart below shows the renewable percentage for each state since 2017, which is the year in which the transition really took hold.

States.png

I've done a projection forward for 3 years for each state. Obviously this is dodgy since it all depends on what is in the pipeline to be built and things like coal-fired power station closures will also have an effect. But there is a clear trend over the past 5 years so it's not entirely meaningless.

Excluding Tassie from the "State of Origin" awards (sorry TAS, we can't give you first prize every year), we have 3 clear groups:
  • The Leader - South Australia - the clear leader in absolute terms but also growing the percentage the fastest. The trend has SA taking slightly more than a year to add 10% to its average renewable level, so at that rate would hit 90% in 2024 and 100% in late 2025. Job done, thanks for playing! HARD!
  • The Pack - WA, VIC and NSW. On the trend, WA and VIC are neck and neck for the next few years, with both reaching 50% by the end of next year. NSW is catching up though, and the increase over the last 2 years has been considerably faster than the 3 years before that - so it will be a tussle! Who will be the first to get to 50% over a full 12-month period? Place your bets!
  • The Also-Ran - QLD. Seriously, you must do better. You have grand plans, but you are a very late mover and I am sceptical on the execution. The trend has not been your friend. We need you to teach Matt Canavan a home-grown lesson.
 
The stats for January - down a bit from the giddy heights of November and December. But overall still 420 basis points up from January last year (i.e. +4.2% absolute) and 900 basis points up from 2 years ago!

Renewable energy generation for January - average for the month:
  • National - 38.9%
  • TAS - 99.0%
  • SA - 82.8%
  • WA - 38.8%
  • NSW - 37.2%
  • VIC - 36.2%
  • QLD - 26.6%
Peak renewable generation for January - and time of occurrence:
  • National - 63.7% on 09 Jan 13:00
  • TAS - 100.0% on 01 Jan 00:00
  • SA - 98.3% on 09 Jan 16:15
  • WA - 80.3% on 17 Jan 14:00
  • NSW - 67.5% on 09 Jan 13:00
  • VIC - 61.2% on 06 Jan 15:30
  • QLD - 58.3% on 21 Jan 11:15
Daytime renewable performance for January - renewable percentage when solar production is not zero:
  • National - 42.9%
  • TAS - 98.7%
  • SA - 85.5%
  • WA - 45.2%
  • NSW - 44.0%
  • VIC - 41.2%
  • QLD - 34.7%
Nighttime renewable performance for January - renewable percentage when solar production is zero:
  • National - 23.7%
  • TAS - 99.5%
  • SA - 76.0%
  • WA - 27.0%
  • VIC - 24.4%
  • NSW - 20.0%
  • QLD - 7.8%
Diurnal renewable hardness for January - ratio of nighttime renewable percentage to daytime:
  • National - 0.55
  • TAS - 1.01
  • SA - 0.89
  • WA - 0.60
  • VIC - 0.59
  • NSW - 0.45
  • QLD - 0.22
Small Scale / Rooftop solar as a proportion of all generation for January - invisible to AEMO:
  • National - 13.8%
  • SA - 27.5%
  • WA - 18.5%
  • NSW - 12.7%
  • QLD - 12.5%
  • VIC - 12.3%
  • TAS - 5.8%
Renewable mix for January - solar includes small-scale solar, hydro includes pumped hydro:
  • National - Wind: 31.3%, Solar: 54.1%, Hydro: 14.7%
  • NSW - Wind: 20.7%, Solar: 63.5%, Hydro: 15.8%
  • QLD - Wind: 10.5%, Solar: 80.5%, Hydro: 9.0%
  • SA - Wind: 57.2%, Solar: 42.8%, Hydro: 0.0%
  • TAS - Wind: 17.5%, Solar: 5.8%, Hydro: 76.6%
  • VIC - Wind: 45.0%, Solar: 45.9%, Hydro: 9.2%
  • WA - Wind: 51.8%, Solar: 48.2%, Hydro: 0.0%
SNSWNB Index for January - sun not shining wind not blowing index: total duration in minutes spread across N separate periods:
  • National - 0 minutes across 0 periods
  • NSW - 0 minutes across 0 periods
  • QLD - 0 minutes across 0 periods
  • SA - 0 minutes across 0 periods
  • TAS - 135 minutes across 3 periods
  • VIC - 0 minutes across 0 periods
  • WA - 0 minutes across 0 periods