Welcome to Tesla Motors Club
Discuss Tesla's Model S, Model 3, Model X, Model Y, Cybertruck, Roadster and More.
Register

Range Loss Over Time, What Can Be Expected, Efficiency, How to Maintain Battery Health

This site may earn commission on affiliate links.
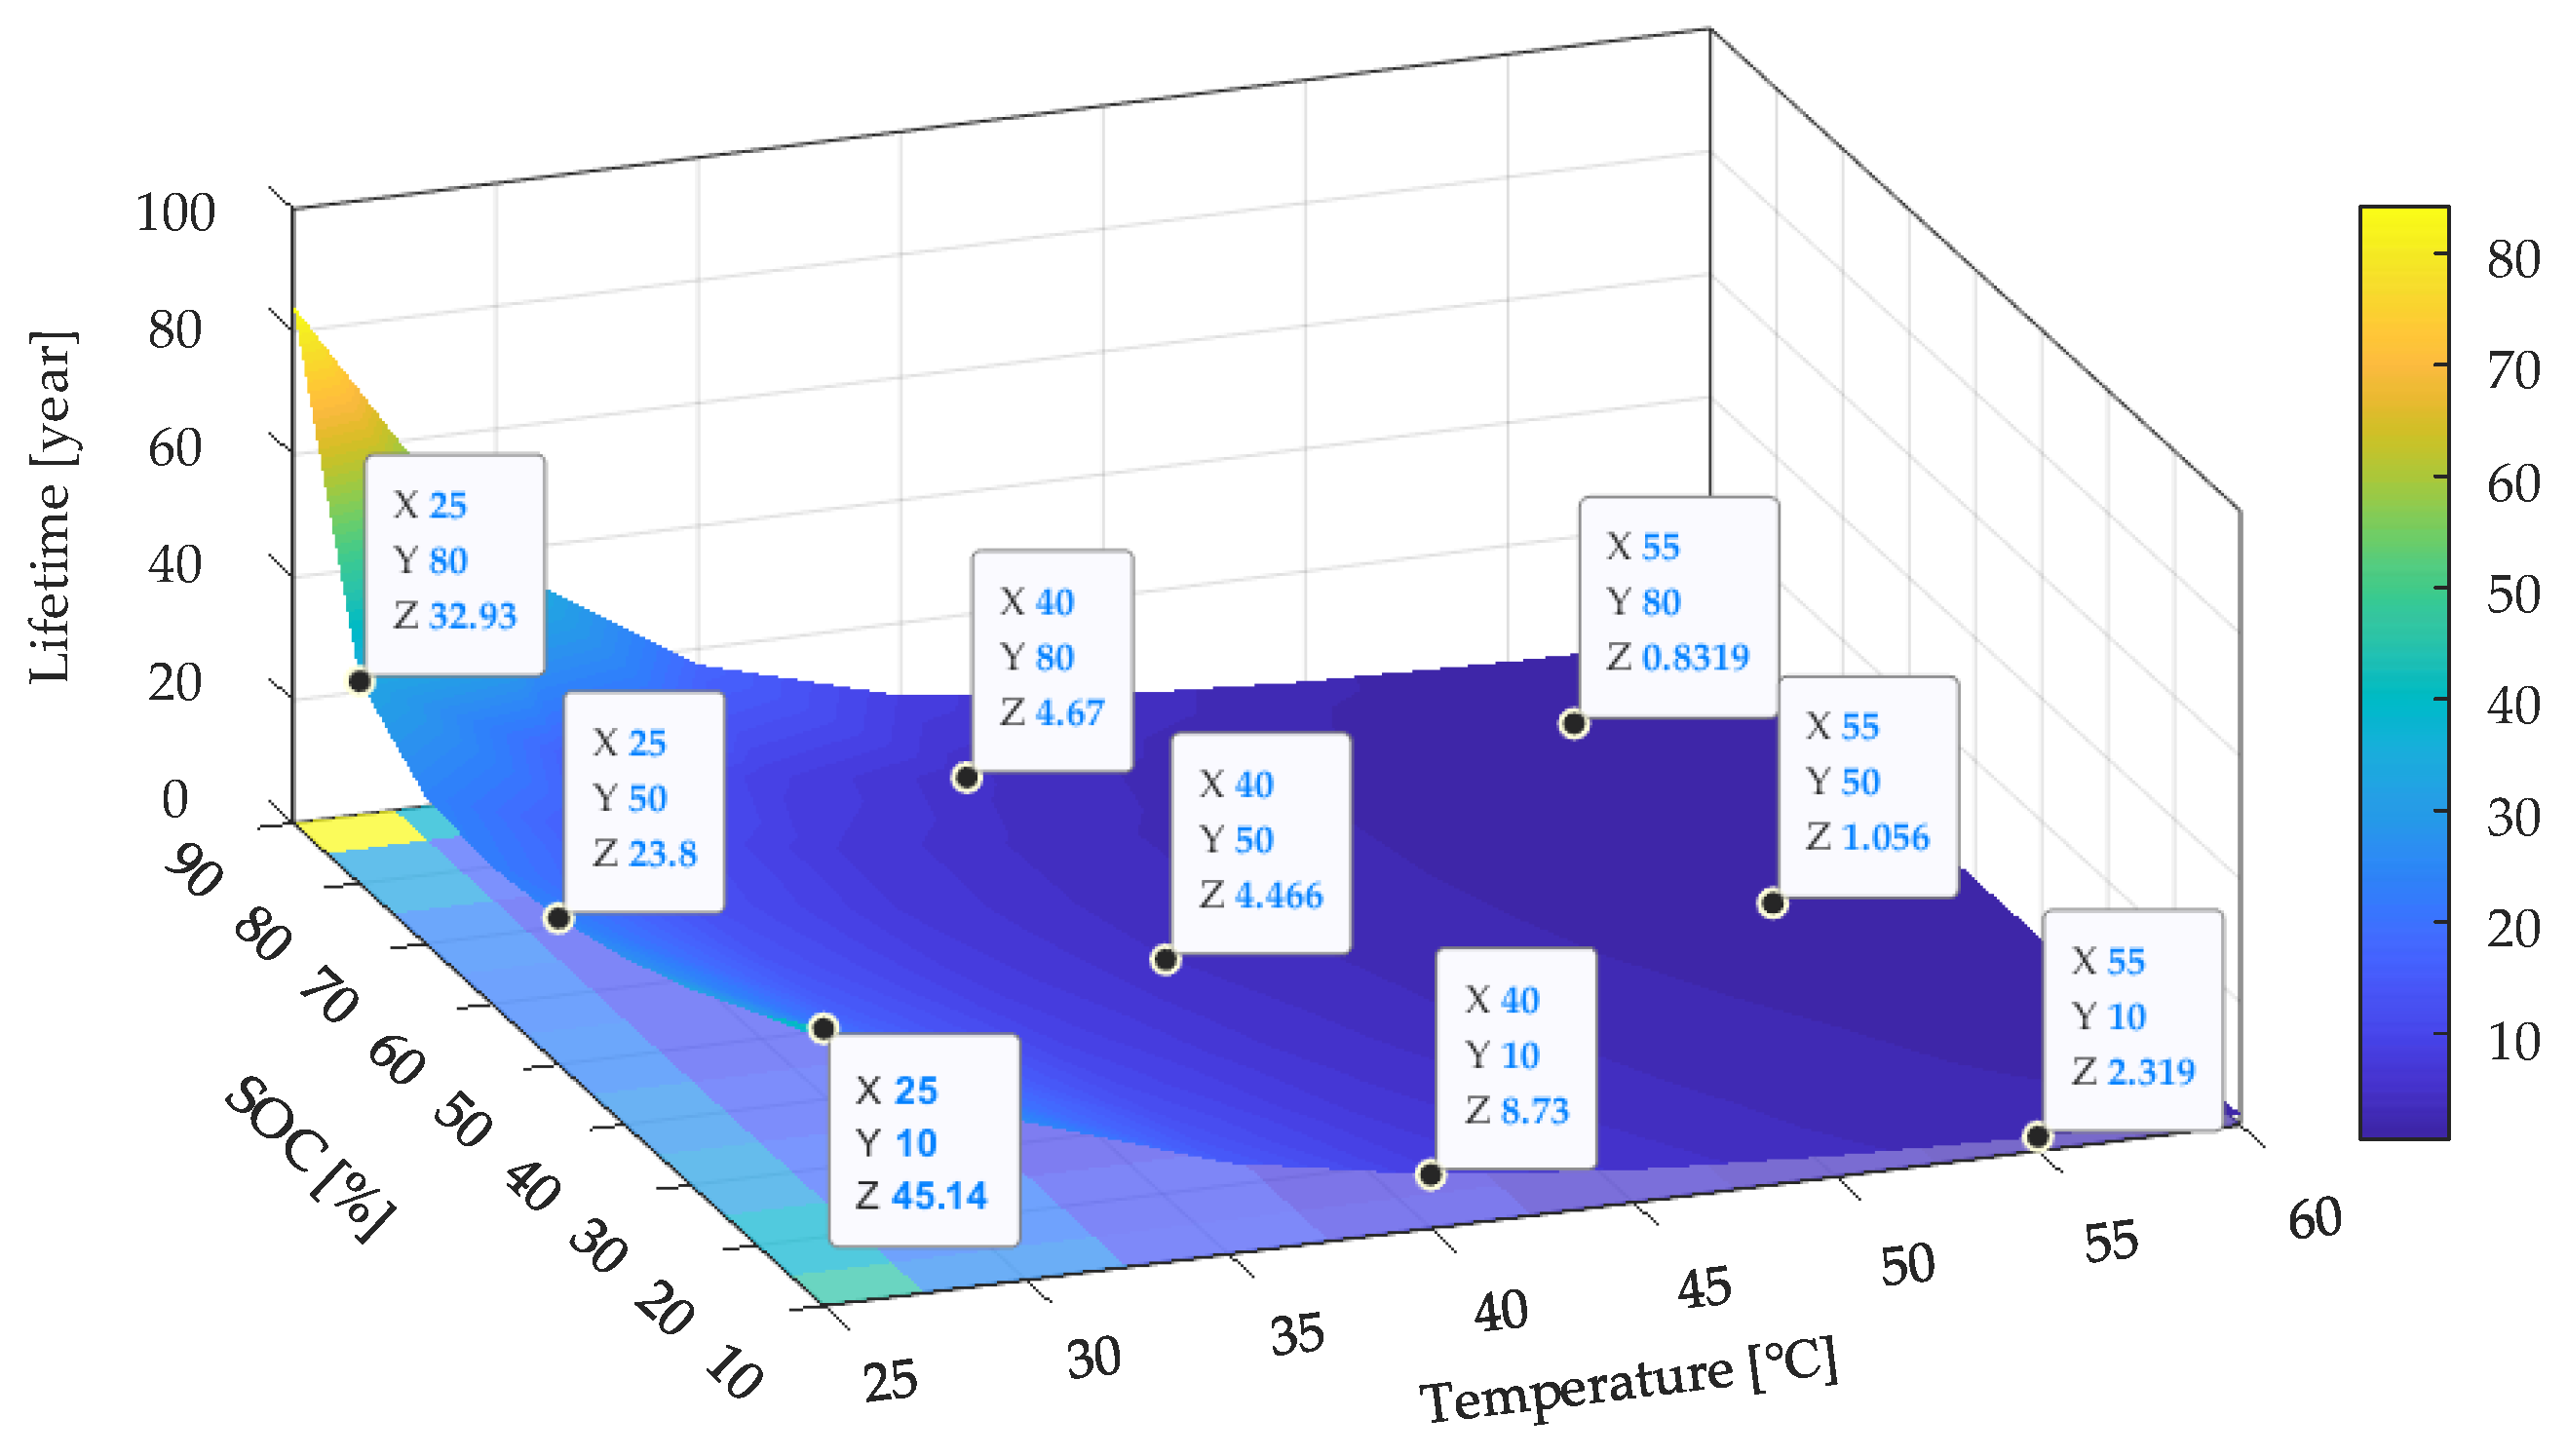
Are there published results showing that SOC and temp do not interact with the sqrt term? That's actually great news because it means that the slowdown rate, d Degradation/d Time is not extended out in time with beneficial SOC and temp management.
The temperature is kind of an inverted square root. Reducing the temp by 10C do not reduce as much degradation as a 10C increase increases it.

SOC is not square root dependent, this we can easily see in the graph.
The region from 30-55% have only a very small increase of degradation with increased SOC.
60 to 90 ( or 100%) show a similar flat curve.
And at the central graphite peak the step is brutal.
 
  • Like
Reactions: johnny_cakes
The temperature is kind of an inverted square root. Reducing the temp by 10C do not reduce as much degradation as a 10C increase increases it.

SOC is not square root dependent, this we can easily see in the graph.
The region from 30-55% have only a very small increase of degradation with increased SOC.
60 to 90 ( or 100%) show a similar flat curve.
And at the central graphite peak the step is brutal.

WHat I meant by square root dependent is whether the coefficient in the square root with time interacts in any way with SOC. That can't be answered by a static plot at one time point.

I.e. there is a sqrt(T/T0) T0 is some scaling coefficient to make the argument non-dimensional. Does that depend on average SOC or temperature?

does dDegradation/dTime / Degradation have a dependence on SOC?
 
Why is this called the "central graphite peak"?
A measurement of the voltage increase per Ah charged vill show a very sharp peak at the central graphite peak. Its the anode side of the cell that causes that peak.
Flat areas indicate a flat part of the Voltsge curve.
Look at the A at 1.6Ah.

0407F92E-F7E9-445C-BF52-1C772C1C0002.jpeg


ShieldSquare Captcha
 
  • Love
Reactions: AlanSubie4Life
WHat I meant by square root dependent is whether the coefficient in the square root with time interacts in any way with SOC. That can't be answered by a static plot at one time point.

I.e. there is a sqrt(T/T0) T0 is some scaling coefficient to make the argument non-dimensional. Does that depend on average SOC or temperature?

does dDegradation/dTime / Degradation have a dependence on SOC?
No, the square root (dT) is about constant over the modt of the SOC range.

5A8635CB-8B6A-42DB-8450-46AD558ECC0D.jpeg


You can see this on the different times lines. The dT is icreasing but the spacing is about constant.
Using the square root (T1/T0) you will find it to match this graph about as fine as the resulotion of the wide lines allow.
Above about 95% you can see a slight divergence from the square root ”theory” but this is not the case in all charts.
 
@AAKEE I have read many of your contributions during last couple of months, thank you for that. I have been the owner of an LFP model Y for several weeks now. I am curious how you view point 4 from your summary of this thread for this type of chemistry.

So far I have always followed the advice around charging to about 55 / 60% and once a week to 100% just before a ride, because it remains a lithium-ion battery, but was in doubt because of this publication: The Degradation Behavior of LiFePO4/C Batteries during Long-Term Calendar Aging and in particular this figure
energies-14-01732-g012.png


Is Tesla's advice for a daily charge to 100% more than balancing the pack at the peak voltage? Or maybe I found a irrelevant research document mismatching Tesla LFP chemistry
That research report is best described live, by coughing and saying ‘bullshit’ at the same time. I’m not even kidding…

Shortly described, they only used three data points for different SOC (at 55C temperature), and then they assumed that the curve is a bath tub curve, and then they assumed some kind of formula for that curve.
The test result actually fit perfectly in the serious research reports that used multiple data points for different SOC.

I did write about this report results a few times before, more in depth: MASTER THREAD: 2021 Model 3 - Charge data, battery discussion etc
 
@AAKEE I have read many of your contributions during last couple of months, thank you for that. I have been the owner of an LFP model Y for several weeks now. I am curious how you view point 4 from your summary of this thread for this type of chemistry.

So far I have always followed the advice around charging to about 55 / 60% and once a week to 100% just before a ride, because it remains a lithium-ion battery, but was in doubt because of this publication: The Degradation Behavior of LiFePO4/C Batteries during Long-Term Calendar Aging and in particular this figure
energies-14-01732-g012.png


Is Tesla's advice for a daily charge to 100% more than balancing the pack at the peak voltage? Or maybe I found a irrelevant research document mismatching Tesla LFP chemistry

The temperatures being tested were 40C, 47.5C and 55C (continuous), which are very high to be relevant for EV applications (maybe energy storage in the desert in Australia?). The only case which had different states of charge, 10%, 50%, and 90%, was 55C, extremely high.

The graph you see is an extrapolation of a numerically fitted model and there isn't a mechanistic explanation of the seemingly unusual results contradicting other experiments. The raw results (Figure 5) shows "Case 1 (50%) and case 5 (90%)" at approximately the same degradation, and case 4 (10%) at lower degradation. And the 90% is accelerated in the early years. This is at 55 C temperature.

This doesn't seem to me like top quality or comprehensive paper. There doesn't seem to be a paper I can find which directly gives evidence for guidance for end-user EV charging habits, like realistic storage temperatures and realistic charging and use cycles.
But none of the underlying chemistry suggests that 50% is going to be worse than 90%.

I'm a ML scientist (former physicist) and I see a number of highly data-driven computational methods being used in research literature (e.g. in another paper kernel methods with Bayesian automated relevance determination model selection principles). I don't think those fancy methods are really appropriate for data which are taken at a dozen or so conditions vs thousands or more of independent observations where ML non-parameteric methods come in to play.

I would strongly prefer fitting chemistry/physics based underlying models and accepting a lower goodness of fit as inevitable from experimental uncertainties, then exploring if there are systematic deviations from them, and if those deviations mean there is unmodeled physics actually present and correcting that with understanding and experimentation.

For example a better sort of paper (which isn't quite calendar aging but related to the discussion of SOC) which looks at 'nonlinear' (more rapid capacity loss) which may be battery failure:


Based on a widespread aging matrix, results indicate an earlier appearance of nonlinear characteristics at high charging rates and operational voltage windows but low temperatures. Scanning electron microscopy images reveal areas of thick surface films at the anode while the cathode stays unmodified. Therefore, a thickening of the solid electrolyte interphase, catalyzed by oxidation products migrating to the anode, is believed to be the dominating aging mechanism before the turning point. Afterwards, lithium plating might even occur at moderate temperatures and charging rates due to deteriorated ionic kinetics and graphite active material loss. As all these mechanisms are dependent on the cell potential, an optimized operational strategy may avoid or retard nonlinear aging characteristics and extend the life of lithium-ion cells.

All the problems occur at the graphite anode. LFP cells have the same graphite anode as NCA and NCM. And dependent on cell potential means "higher state of charge is worse". So it means that with higher state of charge you increase the likelihood for accelerated and probably terminal battery failure. The mechanism starts from the degradation of the graphite anode with lithium, and that's exactly the mechanism for calendar aging which is worse at higher state of charge.

So not only does lower state of charge slow down calendar aging, it slows the very mechanism which later in a battery life (under cycles and age) could cause a rapid deteriation and an expensive full pack replacement. Setting max charge low also means your daily cycles take place at a lower SOC which is also important.


and a recent 2023 article emphasizing the same thing:


How increasing SOC_max is bad bad bad
 
Last edited:
Thank you @AAKEE & @DrChaos for your detailed answers and explanations 👍 I'll have a look into the linked articles. There were indeed very low measurement point taken but it seemed reliable from a university haha. Glad you got it down with good arguments
Sometimes they are, uh, "student papers", more like a lab report than good PhD level research.

Good papers on battery calendar aging are expensive: you need many cells across many states of charge (need to maintain these) and at various temperatures, and lots of time.

Now here's a suggestion/question to actual PhD scientists in the field: does LFP battery seem to have a longer lifetime only because the maximum voltage is limited (and hence capacity) compared to NMC/NCA? After all, if degradation is centered around the anode, which is graphite in all of them, if the physical parameters there are the same (ok electrolyte may be different), would degradation be similar?

So the test is looking at aging/degradation processes of LFP vs nickel cathodes when the nickel battery is charged up to the same max voltages as LFP (and probably similar capacity then). Now, people won't usually use nickel cathodes at low capacity most of the time because it's more expensive than LFP, but it may have some relevance here.

Specifically I think this may be the strategy of the NMC based new accessory battery in Teslas: don't charge so high to get better lifetime, because energy storage isn't so important here.

edit: high open voltage of well charged LFP batteries is 3.4V which is about 4% SOC of NMC batteries so this isn't a great comparison.
 
Last edited:
  • Like
Reactions: AAKEE
does LFP battery seem to have a longer lifetime only because the maximum voltage is limited (and hence capacity) compared to NMC/NCA? After all, if degradation is centered around the anode, which is graphite in all of them, if the physical parameters there are the same (ok electrolyte may be different), would degradation be similar?
Please see this video

Lower voltage is part of the reason. The other part is the crystal structure of LFP vs ternary. The olivine crystal structure of LFP lowers the diffusion rate of lithium ions but also increases stability. One you understand the crystal structure, many of LFP's characteristics become intuitively understandable, such as difficulty fast charging in cold weather.

One interesting side note is that NCA can actually hold much more energy past "100%", but in doing so the crystal structure would be so unstable that it would be extremely detrimental to both safety and long-term battery health.
 
  • Informative
  • Like
Reactions: KenC and DrChaos
Hey there! My stated range in my car is now 207 miles, far from the 267 advertised EP range of my 2021 Model 3 Standard. I ask Tesla, and they keep telling me there are no issues detected. I have NEVER heard of of any degradation being this much, this fast on this forum.

Any advice on how I can push them to find a solution? This is false advertising at this point.
Is that with a 100% SOC?
 
Any advice on how I can push them to find a solution? This is false advertising at this point.
There is no "pushing for a solution" unless or until you hit the battery degradation warranty threshhold. Thats 30% loss, as measured by the information from the car itself (nothing else).

So, there is no "pushing for a solution" from Tesla unless or until your car hits 187 miles at 100% charge, and that is not "I can only drive 187 miles" its "The car reports 187 miles at 100% charge, after a full charge has been completed."

Going to tesla before the battery threshhold is a waste of your time as they will not do anything (there isnt anything they CAN do).
 
  • Like
Reactions: Jejunjm
Hey there! My stated range in my car is now 207 miles, far from the 267 advertised EP range of my 2021 Model 3 Standard. I ask Tesla, and they keep telling me there are no issues detected. I have NEVER heard of of any degradation being this much, this fast on this forum.

Any advice on how I can push them to find a solution? This is false advertising at this point.
Do you have any screenshots of the relevant data?
 
Hey there! My stated range in my car is now 207 miles, far from the 267 advertised EP range of my 2021 Model 3 Standard. I ask Tesla, and they keep telling me there are no issues detected. I have NEVER heard of of any degradation being this much, this fast on this forum.

Any advice on how I can push them to find a solution? This is false advertising at this point.
It could be a BMS calibration issue. Try dropping the SoC below 10%, let is sleep for a few hours, then charge to 100% and let it sleep there for a few hours. I don't know if it'll help, but some people have reported that the BMS recalibrated and reported a higher range. Alternatively you can try the technique described here: How I Recovered Half of my Battery's Lost Capacity, but that'll take a lot longer. If you try any of those techniques, report back here to let us know how it went.
 
Thanks again @AAKEE, great detailed response!

Seems like based on Teslamate my current projected range is about 344, which as you said is only about 3.9% from 358, not the original 8+% I feared!

After reading the "How I Recovered Half of my Battery's Lost Capacity" thread, I will try the following:

Charge up to 90% by 1am
Let the car sit for 6 hours at 90%

Drive to work and arrive with about 84%
Let the car sit for about 8 hours

Drive home and arrive with about 78%
Let the car sit for about 12 hours

Drive to work and arrive with about 70%
Let the car sit for about 8 hours

Drive home and arrive with about 64%
Let the car sit for about 12 hours

Drive to work and arrive with about 55%
Let the car sit for about 8 hours

Drive home and arrive with about 49%
Let the car sit for about 12 hours

Then from this point I will resume my routine of driving the car down to about 25% before charging back up to 50%.

Does this sound like a reasonable plan? Will be interesting to see if this changes my projected range after a week or two.
I wanted to come back and report on my progress since I posted this. For the past approximate three months I have been charging up to 90% and driving down to about 20% and I have seen my projected range increase from 344 to 350! Question is, should I go back to charging only to 50% to save on the calendar aging or keep charging up to 90% to keep the BMS current?

Screenshot 2023-04-21 at 8.59.04 AM.png
 
  • Informative
Reactions: KenC
I wanted to come back and report on my progress since I posted this. For the past approximate three months I have been charging up to 90% and driving down to about 20% and I have seen my projected range increase from 344 to 350! Question is, should I go back to charging only to 50% to save on the calendar aging or keep charging up to 90% to keep the BMS current?

View attachment 930519
I debated this once. Is the avoided degradation greater than the “BMS loss” on capacity? I decided to stick to low SoC charging as any perceived “BMS loss” is recoverable. High SoC degradation is non-recoverable.
 
The BMS is a bit like shopping around for the best blood pressure...it’s very reassuring when you get a low blood pressure and makes the high ones easy to forget...of course you are only fooling yourself. The BMS that reads the highest is of course the correct one....I mean it has to be, right🤷‍♂️
I also go with the logic of saving the battery by having a low state of charge (50%)....but this weekend I am going on a road trip to the beautiful town of Antibes....and I can’t wait to see what my range is with 100%😎