Tesla probably needs to allow for different max charge power and also the discharge without driving, total time might be some hours…Sounds like the car battery must be cycled one time. I'd do this only if absolutely necessary, and in particular if you're at very low SOC. It's going to discharge to low single digits, then charge up to 100% or something. I would guess less than 24hrs, but who knows until someone does it.


Welcome to Tesla Motors Club
Discuss Tesla's Model S, Model 3, Model X, Model Y, Cybertruck, Roadster and More.
Register
Install the app
How to install the app on iOS
You can install our site as a web app on your iOS device by utilizing the Add to Home Screen feature in Safari. Please see this thread for more details on this.
Note: This feature may not be available in some browsers.
-
Want to remove ads? Register an account and login to see fewer ads, and become a Supporting Member to remove almost all ads.
You are using an out of date browser. It may not display this or other websites correctly.
You should upgrade or use an alternative browser.
You should upgrade or use an alternative browser.
Range Loss Over Time, What Can Be Expected, Efficiency, How to Maintain Battery Health
- Thread starter KK_RedM3
- Start date

DuncanM
Member
A full test done to completion.So I just did this (to a point). Pressing the indicator stalk and brake is easy. The key apparently just means you need to have a key, either phone or card, in the vehicle.
This then popped up. I didn't want to have my car off line for 24 hours so I didn't pursue it.
View attachment 868821
search YT for 'BC Tesla Guy'
Thanks for that..I am glad that there is always someone on YouTube who is braver than meA full test done to completion.
search YT for 'BC Tesla Guy'
 ....but is he the most boring man on the internet

Just charged my wife's 2018 Tesla Model 3 LR to 100% for a busy day driving today and tomorrow. (Happy hour with the girls and 60 miles round trip to work tomorrow) Started at 265 miles, charged 100% to 295 miles.
For the life of me I don't recall if the upgrade for LR was 305 miles? (Delivery 10/18)
10 miles loss of range after 4 years? Or am I being too optimistic?
In the last year or so she's taken over charging her Model 3 and is charging more often to 80%. I used to let the mileage go down to around 20% before recharging.
Is 305 miles for the 2018 Model 3 LR correct at 100% charge?
AlanSubie4Life
Efficiency Obsessed Member
You did not specify RWD (325) or AWD (310). If you don’t specify that means RWD, I suppose.Is 305 miles for the 2018 Model 3 LR correct at 100% charge?
These both correspond to 76kWh though the vehicles started with closer to 78kWh.
So either 11.5%, 69kWh (RWD) or 7.5%, 72.3kWh (AWD).
I would guess RWD.
Last edited:
SageBrush
REJECT Fascism
Yes, but no.Is 305 miles for the 2018 Model 3 LR correct at 100% charge?
The car did indeed show about 305 miles when new, but there was a hidden reserve. The actual capacity was either 315 or 324 miles -- or maybe something in-between since not all packs are created exactly equal. So your real loss is somewhere in the range of 20 - 29 miles. If you call it 8% loss, you are going to be about as accurate as is possible.
There is another wrinkle. It is very common, although perhaps not universal. that 3 - 5% is 'lost' the first year. This is not degradation in the sense that we see over the years, but some other chemical process. If that happened with your pack then the subsequent degradation of the typical type has been 3 - 5% over 4 years, or about 1% a year.
Fwiw, my 2018 Model 3 rated range dropped in exactly the manner you are seeing up until late 2021 when it was sold.
CyberGus
Not Just a Member
A full test done to completion.
search YT for 'BC Tesla Guy'
I Googled “done to completion” and got very different results
There is another wrinkle. It is very common, although perhaps not universal. that 3 - 5% is 'lost' the first year. This is not degradation in the sense that we see over the years, but some other chemical process. If that happened with your pack then the subsequent degradation of the typical type has been 3 - 5% over 4 years, or about 1% a year.
Batteries degrade from cyclic aging, but also calendar aging.
Calendar aging is much higher than cyclic aging for most people (cars, really) for at least the five firast years or so.
Calendar aging is reducing by the square root of time, so to double any degradation value you need 4x time.
5-6% is common the firsta year. Year two only cause about 2-2.5% and so on.
Cyclic aging wear much less.
The graph below from a cycle test of a Panasonic NCA.
They did use quite large cycles (about 100-30%), which cause more degradation then smaller cycles. Still, 790 cycles is about 500 Full Cycle equivalent and did cause about 13.5% degradation, so we would get about 1000 FCE before reaching 30% degradation.
This indicates 1000 FCE, which would be about 350.000-400.000 km for a long range car, so this would cost about 0.8% /10.000km. This despite the 100% SOC on each cycle, cycled down to about 30%. In real life, we would be more carefull with our batteries so we would have less degradation per driven mile. This will put us well below 1.6% cyclic aging /20.000km or per year for the average tesla driver. We can probably count with about 1% or less each year from cyclic aging.
AlanSubie4Life
Efficiency Obsessed Member
For LR RWD: 310 when new, before update. ~330 on the EPA test. https://www.fueleconomy.gov/feg/epadata/18data.zip, can see in the formulas what it actually got.The car did indeed show about 305 miles when new, but there was a hidden reserve. The actual capacity was either 315 or 324 miles -- or maybe something in-between since not all packs are created exactly equal. So your real loss is somewhere in the range of 20 - 29 miles. If you call it 8% loss, you are going to be about as accurate as is possible.
This was with energy of over 78kWh.
I think this 310 meant a degradation threshold of 72.5kWh (though hard to know now). Even though the car started with 78kWh or so. I think there are pictures providing evidence that that was the threshold, anyway.
Later it was changed to 325 max display value. This corresponded to a degradation threshold of 76kWh.
And that is how it worked. So 325rmi is the value to use, with 234Wh/rmi.
Can be verified in the car as usual.
At no point did the available energy change. EPA test has always had the ~78kWh+ value.
SageBrush
REJECT Fascism
Calendar aging is reducing by the square root of time, so to double any degradation value you need 4x time.
5-6% is common the firsta year. Year two only cause about 2-2.5% and so on.
There is something to be said for this description but I am not a big fan because the first year capacity loss appears to be distinct from the subsequent 'calendar aging' that is SoC and temperature dependent. Just as an empirical matter, I note three degradation processes:
1. The first 6 months. Pretty much happens no matter what
2. Calendar aging, which amounts to accumulated time spent at SoC over 60%, compounded by time spent at higher temperatures. The effects of storage SoC and pack temperature are geometric
3. Cyclic aging, which is again geometric. A 20% excursion has 4x the aging of a 10% excursion; a 40% excursion has 16x the aging ...
These degradation rates start at *very* low values, so as a practical matter they are hardly noticed below storage SoC of 80% at temperatures below 20C; or in the case of cycling, below 70% excursion around the midpoint.
The user community has learned a lot in 10 years. I think that with modern chemistries and thermal controls it has become pretty clear that for most EV owners the single most important factor is time spent at high SoC and high temperature. Either one alone is not so bad, while both together is best minimized if possible.
Last edited:
Yes, RWDYou did not specify RWD (325) or AWD (310). If you don’t specify that means RWD, I suppose.
These both correspond to 76kWh though the vehicles started with closer to 78kWh.
So either 11.5%, 69kWh (RWD) or 7.5%, 72.3kWh (AWD).
I would guess RWD.
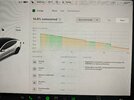
I have noticed my battery level jumping up and down by up to 3% when it is not charging. It was hard to show before, but with the latest energy app update it is obvious.
In the first image the jump is only down, but it is obviously not from usage, because the starting SOC is 80% the ending SOC is 61% and the energy consumed is about 15%. So, 80-61=19% so the missing 4% is about what you see in the gap down.
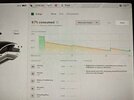
The second image is of another run, where you actually see the jump up as well as down. The jump up is much smaller though.
Does anyone else see this? Is it normal behavior or there is something wrong with my battery?
In the first image the jump is only down, but it is obviously not from usage, because the starting SOC is 80% the ending SOC is 61% and the energy consumed is about 15%. So, 80-61=19% so the missing 4% is about what you see in the gap down.
The second image is of another run, where you actually see the jump up as well as down. The jump up is much smaller though.
Does anyone else see this? Is it normal behavior or there is something wrong with my battery?
Attachments
Look at the "Park" page. I haven't had the latest update long, but are those vertical dashed lines where you stopped? Did the 4% get consumed while parking?
Obviously the next question would be, if the car is consuming energy when parked, why would there be any rise in percentage? My impression is that sometimes if I stop in the sun, the car warms while I'm gone, and the battery shows more SOC when I come back.
Obviously the next question would be, if the car is consuming energy when parked, why would there be any rise in percentage? My impression is that sometimes if I stop in the sun, the car warms while I'm gone, and the battery shows more SOC when I come back.
The consumed energy while parked is 1% and the current charge level is 60%. The 3% energy is certainly not accounted for. Also, I have definitely seen the SOC jump up by 3% while parked, obviously while not charging. I am just trying to find out if this is common to all cars or there is an issue with mine.
AlanSubie4Life
Efficiency Obsessed Member
Yes, this is normal.Does anyone else see this? Is it normal behavior or there is something wrong with my battery?
Obviously can look at the park page and add usage there to these jumps.
The BMS is re-evaluating the actual available energy after the car goes into sleep, when the car can get a good handle on it due to no current draw from HV pack. And rebalancing. Routine and has happened for years. Jumps up and down are possible and happen all the time.
I wouldn’t expect to see these jumps if you use Sentry (after adding the Sentry use back to the jumps of course - there will be jumps down but just add the used energy back). But not sure about that - the car could still have some capabilities to re-estimate the SOC even when the contactors are closed.
All makes sense I think.
Last edited:
I don't have the latest firmware w/that energy monitor screen, but I have seen my SOC jumping up/down a few percent after parking.I have noticed my battery level jumping up and down by up to 3% when it is not charging. It was hard to show before, but with the latest energy app update it is obvious.
In the first image the jump is only down, but it is obviously not from usage, because the starting SOC is 80% the ending SOC is 61% and the energy consumed is about 15%. So, 80-61=19% so the missing 4% is about what you see in the gap down.
The second image is of another run, where you actually see the jump up as well as down. The jump up is much smaller though.
Does anyone else see this? Is it normal behavior or there is something wrong with my battery?
Some recent examples (I normally charge to 50-55% and use Teslamate to monitor / verify things like this and ensure it wasn't cabin overheat protection kicking in causing drops in SOC):
Charged to 70% in the middle of the night - in the morning a few hours after done charging, the car reported 67%.
End drive at 52% - couple hours later it jumps back up to 55%.
In this case, it ended up being a wash, but I have to wonder it the BMS is slightly confused after charging to mostly 50-55% for a long time.
I also noticed that my pack balance is pretty significant around 40-50% SOC - 8-10 mV between the min/max and the reported CAC values are pretty widespread, too, reporting 192/202/203 min/avg/max. I suspect the avg/max are high, the last time I looked the min/avg/max was 192/193/195 which is much more reasonable for tolerance. Cell imbalance was even higher, though at 12 mV (SOC was higher at 75%, though).
Anyway, I'm not worrying about it, but will charge to 90% the next time with a handful of hours to rest before driving the next longer trip I take.
Scanmytesla screenshots from the other day on the left, from two weeks ago on the right.
I've never seen 18mv imbalance. Were you driving, that shows more variation.I don't have the latest firmware w/that energy monitor screen, but I have seen my SOC jumping up/down a few percent after parking.
Some recent examples (I normally charge to 50-55% and use Teslamate to monitor / verify things like this and ensure it wasn't cabin overheat protection kicking in causing drops in SOC):
Charged to 70% in the middle of the night - in the morning a few hours after done charging, the car reported 67%.
End drive at 52% - couple hours later it jumps back up to 55%.
In this case, it ended up being a wash, but I have to wonder it the BMS is slightly confused after charging to mostly 50-55% for a long time.
I also noticed that my pack balance is pretty significant around 40-50% SOC - 8-10 mV between the min/max and the reported CAC values are pretty widespread, too, reporting 192/202/203 min/avg/max. I suspect the avg/max are high, the last time I looked the min/avg/max was 192/193/195 which is much more reasonable for tolerance. Cell imbalance was even higher, though at 12 mV (SOC was higher at 75%, though).
Anyway, I'm not worrying about it, but will charge to 90% the next time with a handful of hours to rest before driving the next longer trip I take.
Scanmytesla screenshots from the other day on the left, from two weeks ago on the right.
View attachment 871159View attachment 871161
AlanSubie4Life
Efficiency Obsessed Member
Glad Tesla has added this new display. One more peeling of the onion and should reduce the number of questions from owners, hopefully.
This was discussed elsewhere recently. It appears they do account for (display) BMS adjustments (just don’t call it out specifically….which they really should I think…otherwise…more questions…always more questions!). (Due to the way the display shows % vs. miles they must display these adjustments, they have no choice.)
This was discussed elsewhere recently. It appears they do account for (display) BMS adjustments (just don’t call it out specifically….which they really should I think…otherwise…more questions…always more questions!). (Due to the way the display shows % vs. miles they must display these adjustments, they have no choice.)
Sometimes they are positive losses, sometimes they are negative losses (gain in miles/km/% after parking), but overall of course they eventually add up to net losses.)
Does it track use in Park (I don’t have it)? That was what I thought would be more difficult to implement (specifically sleep mode losses (and gains)), though definitely possible since it is possible to do by hand.
I’m curious how negative usage will be tabulated, or whether they will set a floor of 0 on the display.
Other SOC changes, for example due to BMS adjustments, would not be shown.
Last edited:
Mine is at 285 for a 2018 M3LR RWD with aero wheels. You are doing well.Just charged my wife's 2018 Tesla Model 3 LR to 100% for a busy day driving today and tomorrow. (Happy hour with the girls and 60 miles round trip to work tomorrow) Started at 265 miles, charged 100% to 295 miles.
For the life of me I don't recall if the upgrade for LR was 305 miles? (Delivery 10/18)
10 miles loss of range after 4 years? Or am I being too optimistic?
In the last year or so she's taken over charging her Model 3 and is charging more often to 80%. I used to let the mileage go down to around 20% before recharging.
Is 305 miles for the 2018 Model 3 LR correct at 100% charge?
Okay, I've only had the latest software with the energy screen for a few days, plus I don't usually look at the "Rated" screen. I usually look at the "Trip" screen. But today, I tried out the Rated screen, and I noticed that when I stopped, for a couple hours, the SOC increased almost 1%, at the 10 mile mark.I have noticed my battery level jumping up and down by up to 3% when it is not charging. It was hard to show before, but with the latest energy app update it is obvious.
In the first image the jump is only down, but it is obviously not from usage, because the starting SOC is 80% the ending SOC is 61% and the energy consumed is about 15%. So, 80-61=19% so the missing 4% is about what you see in the gap down.
The second image is of another run, where you actually see the jump up as well as down. The jump up is much smaller though.
Does anyone else see this? Is it normal behavior or there is something wrong with my battery?
What do I think based upon one datapoint? I would say my battery was fairly cold, sitting in the garage in the 50s, when I started, and I drove for 20mins. The car sat for 2hrs in the sun about 64F ambient, and the BMS recalculated based upon the warmer battery and it was 1% more. On some days, as you've noted, I've seen the BMS increase 3%, when I parked my cold car in the sun.
Similar threads
- Replies
- 43
- Views
- 3K
- Replies
- 1
- Views
- 150
- Replies
- 10
- Views
- 528
- Replies
- 13
- Views
- 605
- Replies
- 3
- Views
- 190