


Welcome to Tesla Motors Club
Discuss Tesla's Model S, Model 3, Model X, Model Y, Cybertruck, Roadster and More.
Register
Install the app
How to install the app on iOS
You can install our site as a web app on your iOS device by utilizing the Add to Home Screen feature in Safari. Please see this thread for more details on this.
Note: This feature may not be available in some browsers.
-
Want to remove ads? Register an account and login to see fewer ads, and become a Supporting Member to remove almost all ads.
You are using an out of date browser. It may not display this or other websites correctly.
You should upgrade or use an alternative browser.
You should upgrade or use an alternative browser.
TSLA Technical Analysis
- Thread starter Robert.Boston
- Start date
-
- Tags
- TSLA
A stock’s 50% decline from a high usually results in at least a strong bounce, and often defines a long-term bottom. The all-time intraday high for TSLA was $389.61 on 2017 SEP 18. Half of that is $194.805. Today’s low was a little under at $193.36, The price has since been hovering around the 50% decline level. Closing above could be an encouraging technical sign.
Last edited:
anthonyj
Stonks
Technicals are broken until Tesla (anyone other than Elon) can calm the market about demand and solvency
Hope you are right, if not we could go visit 38% level at 147ish...A stock’s 50% decline from a high usually results in at least a strong bounce, and often defines a long-term bottom. The all-time intraday high for TSLA was $389.61 on 2017 SEP 18. Half of that is $194.805. Today’s low was a little under at $193.36, The price has since been hovering around the 50% decline level. Closing above could be an encouraging technical sign.
TMS
Member
For my first ignorant post, may I ask why many people are suggesting 180 as support level?
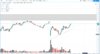
That's why. The yellow area around 180 is a strong support region, with 2 converging lines of support, and as others here mentioned, were also in oversold territory!
sunny-value
Member
That's why. The yellow area around 180 is a strong support region, with 2 converging lines of support, and as others here mentioned, were also in oversold territory!
View attachment 410750
what does oversold mean in terms of the charts and all those colored curves? why is it called 'oversold'?
anthonyj
Stonks
There is no such thing as oversold when investors are basically chickens running around with their heads cut off. Why can’t we get real guidance? It’s insane. Musk thinks he can save the stock from free fall by saying 90-100k cars? No one believes that. Just like enhanced summon has been coming out next week since November 1st. I’m just hoping that someone large is slowly building up a huge stake in Tesla. Hope isn’t an investment strategy though
TMS
Member
what does oversold mean in terms of the charts and all those colored curves? why is it called 'oversold'?
The MACD indicator at the bottom of this chart shows when is the stock overbought (green arrow), and when it is oversold (red arrow).
This is where we are now, in oversold territory (based on an almost 7 months period). This means that a reversal to the upside is possible based on the price movement and other indicators. You can read more about the use of MACD here:
Moving Average Convergence Divergence (MACD)
And no, TA is not dead, if you know how to use it and what to look at. Trading using only fundamentals is like driving blindfolded!
And by the way, this thread is called "TSLA Technical Analysis"
")
TMS
Member
Another confirmation that TA works, on March 22nd 2019, Analysts at "Cowen" set the $180 price target for TSLA:
TSLA – Analysts at Cowen on Friday lowered their price target on Tesla Inc. shares to $180, from $200.
This price level ($180) figured at least 3 times in the past few years, Goldman Sachs predicted it in 2017, Bank of America in 2018, and even JP Morgan back in February 2015 (it actually went down to $182 a month later!). So $180 is a significant number, mark my words!
Another confirmation that TA works, on March 22nd 2019, Analysts at "Cowen" set the $180 price target for TSLA:
TSLA – Analysts at Cowen on Friday lowered their price target on Tesla Inc. shares to $180, from $200.
This price level ($180) figured at least 3 times in the past few years, Goldman Sachs predicted it in 2017, Bank of America in 2018, and even JP Morgan back in February 2015 (it actually went down to $182 a month later!). So $180 is a significant number, mark my words!
178.53 according to this guy.
pdq
Member
TSLA is acting like any other stock that faces headwinds. In this case it is concern over production numbers, FCF, cash burn rate, and Elon losing credibility with Wall Street analysts. As an investor for many years, I've seen this movie many times, so I think that it's going to take some pretty dramatic items to turn the technicals around in any meaningful way.
bdy0627
Active Member
Dramatic items?TSLA is acting like any other stock that faces headwinds. In this case it is concern over production numbers, FCF, cash burn rate, and Elon losing credibility with Wall Street analysts. As an investor for many years, I've seen this movie many times, so I think that it's going to take some pretty dramatic items to turn the technicals around in any meaningful way.
peopleofcolor
Banned
Thank you.That's why. The yellow area around 180 is a strong support region, with 2 converging lines of support, and as others here mentioned, were also in oversold territory!
View attachment 410750
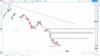
TSLA is coiling in a narrow trading range. The stock will make a big move soon.
In which direction?
bdy0627
Active Member
Yeah, that's what I'd like to know too, preferably ahead of time.In which direction?
hershey101
Active Member
I wish I knew. Not sure right now, but the chart looks bearish to me.In which direction?
TSLA is coiling in a narrow trading range. The stock will make a big move soon.
I guess we are going down.
Attachments
Similar threads
- Replies
- 21
- Views
- 6K
- Replies
- 3
- Views
- 913
- Locked
- Replies
- 0
- Views
- 3K
- Replies
- 23
- Views
- 768