Sorry if I'm being dense - what address bar?
Is there a comprehensive "how to" on Tessie somewhere? This is the 2nd feature mentioned here that I didn't realize was there nor where to find it. The other was a map showing current range - still can't find that one.
I really like the app but it's not particularly intuitive.


Welcome to Tesla Motors Club
Discuss Tesla's Model S, Model 3, Model X, Model Y, Cybertruck, Roadster and More.
Register
Install the app
How to install the app on iOS
You can install our site as a web app on your iOS device by utilizing the Add to Home Screen feature in Safari. Please see this thread for more details on this.
Note: This feature may not be available in some browsers.
-
Want to remove ads? Register an account and login to see fewer ads, and become a Supporting Member to remove almost all ads.
You are using an out of date browser. It may not display this or other websites correctly.
You should upgrade or use an alternative browser.
You should upgrade or use an alternative browser.
Vendor Official Tessie app talk
- Thread starter James@Tessie
- Start date
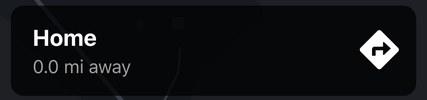
Use words. Icons alone are not enough particularly when there's no possibility of hovering for help.Here's how to find the location screen, the address bar and directions, and the range map:
View attachment 898641
View attachment 898640
View attachment 898642
Would love any suggestions for how to make any of it more intuitive.
KArnold
Active Member
There's lots of detail at Using Tessie - Help Center - Tessie which is labeled "Using Tessie". That's great but this page isn't really "features" as I would use that term.Would love any suggestions for how to make any of it more intuitive.
I.e., I don't see any menu setting on that page indicating this "range map" feature. If you search the help page for "range" or "range map", it doesn't show up. In fact, now that you've told me specifics, I still can't find it on the help page. Maybe I'm searching incorrectly. I didn't even realize that address icon was even clickable.
Perhaps make any link a different color compared to static text. As it is you cannot tell what is "clickable" based solely on appearance.
Maybe reorganize your Help page. In today's busy world, the HELP page needs to be organized in both a brief "feature, short sentence on what/where it is" along with more details for those who want excruciating details. Looks like you have the latter but not the former. Maybe add a "features" or "overview" page that says something like:
Make those one liners into a hyperlink to the detailed pages on the same topic. Just go top down, left to right.Overview:
- Hamburger icon,top left home screen:
- Garage - Managed locations - for each car on your Tessie account, manage:
- Driving History - yada yada
- Charging History - yada yada
- Parking
- Etc.
- Saved Locations - manage favorite, electrical costs at that location, etc.
Thanks for the feedback!There's lots of detail at Using Tessie - Help Center - Tessie which is labeled "Using Tessie". That's great but this page isn't really "features" as I would use that term.
I.e., I don't see any menu setting on that page indicating this "range map" feature. If you search the help page for "range" or "range map", it doesn't show up. In fact, now that you've told me specifics, I still can't find it on the help page. Maybe I'm searching incorrectly. I didn't even realize that address icon was even clickable.
Perhaps make any link a different color compared to static text. As it is you cannot tell what is "clickable" based solely on appearance.
Maybe reorganize your Help page. In today's busy world, the HELP page needs to be organized in both a brief "feature, short sentence on what/where it is" along with more details for those who want excruciating details. Looks like you have the latter but not the former. Maybe add a "features" or "overview" page that says something like:
Make those one liners into a hyperlink to the detailed pages on the same topic. Just go top down, left to right.
Not all features have their own help page, but I think you're right and that this one deserves a call out.
I've created this and it's live now on that page you linked: Range Map.
ken830
Model S 85, Model 3 Performance, Model X LongRange
@James@Tessie: First off, thanks for the quick reply (and fix) to my e-mail about the chart rounding the y-axis labels in the app! And I didn't know about the range map. Very neat feature and could be super useful someday!
I want to make a feature request in the Drives section. As we move (hover) our finger (or mouse cursor) over the charts, it shows the time and value at that point in time (instantaneous value). It would be great to:
I want to make a feature request in the Drives section. As we move (hover) our finger (or mouse cursor) over the charts, it shows the time and value at that point in time (instantaneous value). It would be great to:
- Draw a DOT on the map of the location corresponding to that point in time.
- We can see the instantaneous value on all of the charts at that same point in time.
Yep! I'm experimenting with some ideas just like this. As you point out, this is tricky to achieve. It will definitely be coming before too long.@James@Tessie: First off, thanks for the quick reply (and fix) to my e-mail about the chart rounding the y-axis labels in the app! And I didn't know about the range map. Very neat feature and could be super useful someday!
I want to make a feature request in the Drives section. As we move (hover) our finger (or mouse cursor) over the charts, it shows the time and value at that point in time (instantaneous value). It would be great to:
I understand there might be larger UI implications here like we'll have to lock the map to the top of the screen and maybe have some way to lock/pin some of the other charts and/or shrink them to make this more useful. Or maybe combine several data traces (customizable) onto one graph. At the very least, I would like the corresponding dot on the map. A lot of apps do something like this (See Strava for an example of a chart with elevation/distance/grade and a corresponding dot on a map). What do you think of this idea?
- Draw a DOT on the map of the location corresponding to that point in time.
- We can see the instantaneous value on all of the charts at that same point in time.
ken830
Model S 85, Model 3 Performance, Model X LongRange
Thank you!Yep! I'm experimenting with some ideas just like this. As you point out, this is tricky to achieve. It will definitely be coming before too long.
KArnold
Active Member
It's coming! Have a couple other big features coming out first.Speaking of feature requests I do miss the software installation history of TeslaFi.
ilovecoffee
Member
Can anyone else please confirm that the Tessie website dashboard spikes Chrome usage to 100% on Windows Task Manager? I've got a pretty beefy CPU
Chrome's built in task manager shows it's flutter_service_worker.js and immediately takes a memory footprint of 320mb and Javascript memory of 54mb
Chrome's built in task manager shows it's flutter_service_worker.js and immediately takes a memory footprint of 320mb and Javascript memory of 54mb
It renders using HTML5 Canvas, which is relatively heavy and relies on your GPU. On my Windows machines with dedicated GPUs, Chrome is at 0.2-1.6% on the live dashboard. They're fairly powerful computers though.Can anyone else please confirm that the Tessie website dashboard spikes Chrome usage to 100% on Windows Task Manager? I've got a pretty beefy CPU
Chrome's built in task manager shows it's flutter_service_worker.js and immediately takes a memory footprint of 320mb and Javascript memory of 54mb
If your CPU is pegged at 100% I'm thinking it's a lower-end chipset, there's a browser extension conflict, or there's a driver issue with Chrome's hardware acceleration. I'd try disabling browser extensions and playing with Chrome's Settings > Advanced > System > Use Hardware Acceleration setting. Do either of these fix it for you?
thefrog1394
Member
@James@Tessie: First off, thanks for the quick reply (and fix) to my e-mail about the chart rounding the y-axis labels in the app! And I didn't know about the range map. Very neat feature and could be super useful someday!
I want to make a feature request in the Drives section. As we move (hover) our finger (or mouse cursor) over the charts, it shows the time and value at that point in time (instantaneous value). It would be great to:
I understand there might be larger UI implications here like we'll have to lock the map to the top of the screen and maybe have some way to lock/pin some of the other charts and/or shrink them to make this more useful. Or maybe combine several data traces (customizable) onto one graph. At the very least, I would like the corresponding dot on the map. A lot of apps do something like this (See Strava for an example of a chart with elevation/distance/grade and a corresponding dot on a map). What do you think of this idea?
- Draw a DOT on the map of the location corresponding to that point in time.
- We can see the instantaneous value on all of the charts at that same point in time.
Yep! I'm experimenting with some ideas just like this. As you point out, this is tricky to achieve. It will definitely be coming before too long.
I second this request. Just was thinking yesterday that I miss this from TeslaMate.
ilovecoffee
Member
It renders using HTML5 Canvas, which is relatively heavy and relies on your GPU. On my Windows machines with dedicated GPUs, Chrome is at 0.2-1.6% on the live dashboard. They're fairly powerful computers though.
If your CPU is pegged at 100% I'm thinking it's a lower-end chipset, there's a browser extension conflict, or there's a driver issue with Chrome's hardware acceleration. I'd try disabling browser extensions and playing with Chrome's Settings > Advanced > System > Use Hardware Acceleration setting. Do either of these fix it for you?
You're right that was the problem, I must've disabled Hardware Acceleration earlier due to some other issue in the past and never really noticed any issues with other sites. I have an RTX 3060 Ti so it went away after I enabled it back.
thefrog1394
Member
Another few small things I miss from TeslaMate:
Also, and not sure if all of the data is available for this through the API, but it would be cool to see while charging how much power is being pulled from the charger vs going to the battery. I.e. 60kW from supercharger, 55kW going to battery, 5kW to other (battery heating & cabin conditioning)
There's a few other things I've come across that I'd love to see. But overall, great app! Especially love how often you are updating it. TeslaMate is awesome, and hard to beat as an open source tool, but it's fun to use something that has new features every few weeks.
EDIT: Oh, and this one is a long shot, but it would be awesome to see CAN data from ScanMyTesla in here as well in the future. ScanMyTesla has the ability to dump data to an external API (designed for TeslaLogger which is open source). So this is technically very possible. TeslaLogger is buggy, but having things like cell temps overlayed on charging data is pretty epic.
- Icons on home screen to indicate whether a person is in the seat(s?), door/windows open
- Battery percent, indicate both cold-reduced-% and real %
- Teslamate would do show something like 12% (18%) when some battery % was unavailable due to cold
- More prominent battery %. Would be nice to see it in large font at the top.
- kwH charged on AC vs DC in charging analytics
Also, and not sure if all of the data is available for this through the API, but it would be cool to see while charging how much power is being pulled from the charger vs going to the battery. I.e. 60kW from supercharger, 55kW going to battery, 5kW to other (battery heating & cabin conditioning)
There's a few other things I've come across that I'd love to see. But overall, great app! Especially love how often you are updating it. TeslaMate is awesome, and hard to beat as an open source tool, but it's fun to use something that has new features every few weeks.
EDIT: Oh, and this one is a long shot, but it would be awesome to see CAN data from ScanMyTesla in here as well in the future. ScanMyTesla has the ability to dump data to an external API (designed for TeslaLogger which is open source). So this is technically very possible. TeslaLogger is buggy, but having things like cell temps overlayed on charging data is pretty epic.
Last edited:
Another few small things I miss from TeslaMate:
- Icons on home screen to indicate whether a person is in the seat(s?), door/windows open
- Battery percent, indicate both cold-reduced-% and real %
- Teslamate would do show something like 12% (18%) when some battery % was unavailable due to cold
- More prominent battery %. Would be nice to see it in large font at the top.
- kwH charged on AC vs DC in charging analytics
Also, and not sure if all of the data is available for this through the API, but it would be cool to see while charging how much power is being pulled from the charger vs going to the battery. I.e. 60kW from supercharger, 55kW going to battery, 5kW to other (battery heating & cabin conditioning)
There's a few other things I've come across that I'd love to see. But overall, great app! Especially love how often you are updating it. TeslaMate is awesome, and hard to beat as an open source tool, but it's fun to use something that has new features every few weeks.
EDIT: Oh, and this one is a long shot, but it would be awesome to see CAN data from ScanMyTesla in here as well in the future. ScanMyTesla has the ability to dump data to an external API (designed for TeslaLogger which is open source). So this is technically very possible. TeslaLogger is buggy, but having things like cell temps overlayed on charging data is pretty epic.
- There is no data for "in seat", but "user proximity" is a thing. Will consider it.
- Doors/windows icons are shown when open.
- Prominent battery % can be enabled under Settings > Display > Battery Range.
- Energy usage vs added to battery is displayed, but there's no way to know via the API where the gap is going - e.g. whether it's all efficiency loss or all going to the climate system.
- Cold reduction amount is indicated by a blue bar on the battery. Will consider adding an explicit number for it.
Last edited:
thefrog1394
Member
Thanks for the ideas! Good stuff here.
- There is no data for "in seat", but "user proximity" is a thing. Will consider it.
- Doors/windows icons are shown when open.
- Prominent battery % can be enabled under Settings > Display > Battery Range.
- Energy usage vs added to battery is displayed, but there's no way to know via the API where the gap is going - e.g. whether it's all efficiency loss or all going ot the climate system.
- Cold reduction amount is indicated by a blue bar on the battery. Will consider adding an explicit number for it.
Thanks this helps a lot! Also noticed that displaying efficiency in lists is an option, which is great. Would love to have that be a choice between % or wh/mi.
Something else I noticed while tagging a bunch of drives retroactively (trailer vs bike carrier vs nothing so I have better efficiency data) is that there's no way to open the detail view in a new tab. And clicking back resets you to the default filter settings and first page.
I think that's enough feedback for one day
")
Works OK on my 12 year old MacBook Pro without a discreet GPU. I hadn’t run Chrome on it for a while so gave it a go to see what would happen… no fans running and no unusually big numbers on CPU. (Normally use Firefox as Safari can’t be updated to latest version due to OS version limitations. I’ll have to give in and get something newer some day but it still does what it does…)It renders using HTML5 Canvas, which is relatively heavy and relies on your GPU. On my Windows machines with dedicated GPUs, Chrome is at 0.2-1.6% on the live dashboard. They're fairly powerful computers though.
If your CPU is pegged at 100% I'm thinking it's a lower-end chipset, there's a browser extension conflict, or there's a driver issue with Chrome's hardware acceleration. I'd try disabling browser extensions and playing with Chrome's Settings > Advanced > System > Use Hardware Acceleration setting. Do either of these fix it for you?
That's awesome to hear!Works OK on my 12 year old MacBook Pro without a discreet GPU. I hadn’t run Chrome on it for a while so gave it a go to see what would happen… no fans running and no unusually big numbers on CPU. (Normally use Firefox as Safari can’t be updated to latest version due to OS version limitations. I’ll have to give in and get something newer some day but it still does what it does…)
MichaelMuni
Member
How about the option to create notifications that alert you when you reach the number of mile you have set.
For example, I could set a Tire Rotation notification for 6,000 Miles and then once I reach 6K miles I get notified about the tire rotation. I can then reset the alert once I rotate the tires, and it will notify me the next time I add an additional 6,000 miles to the car.
I know we can set a trip in the car to track this but in the car, you only have the option to set up 3 trips and if you take the car in for service it is possible that they could reset your trip counters. Tessie should be able to track it in relation to the car's odometer wich never can be reset.
Yes! I'm in the middle of working on tire rotation reminders.How about the option to create notifications that alert you when you reach the number of mile you have set.
For example, I could set a Tire Rotation notification for 6,000 Miles and then once I reach 6K miles I get notified about the tire rotation. I can then reset the alert once I rotate the tires, and it will notify me the next time I add an additional 6,000 miles to the car.
I know we can set a trip in the car to track this but in the car, you only have the option to set up 3 trips and if you take the car in for service it is possible that they could reset your trip counters. Tessie should be able to track it in relation to the car's odometer wich never can be reset.
Similar threads
- Replies
- 39
- Views
- 6K
- Replies
- 6
- Views
- 11K
- Replies
- 79
- Views
- 54K
- Replies
- 16K
- Views
- 1M