i have basically the same car. do you know which battery/DU/etc we fall into on the table that is posted here?Just got my Dec 2016 171xxx MS 75D uncorked yesterday. Haven't had time or space yet to do 0-60 runs. However with Powertools, did do some run logs, seen my peak power fluctuate with SOC. A few data points for the peak kW/SOC, 326kW/46%, 335kW/65%, 355kW/89%.


Welcome to Tesla Motors Club
Discuss Tesla's Model S, Model 3, Model X, Model Y, Cybertruck, Roadster and More.
Register
Install the app
How to install the app on iOS
You can install our site as a web app on your iOS device by utilizing the Add to Home Screen feature in Safari. Please see this thread for more details on this.
Note: This feature may not be available in some browsers.
-
Want to remove ads? Register an account and login to see fewer ads, and become a Supporting Member to remove almost all ads.
You are using an out of date browser. It may not display this or other websites correctly.
You should upgrade or use an alternative browser.
You should upgrade or use an alternative browser.
Upgraded performance Metrics Summary
- Thread starter Krash
- Start date
All drive units before June 2017 are old(er) and a US 75kWh battery is almost certainly BTX5. I only know one BTX7 owner. All the BTX8 owners are outside the US. You can check your option codes or battery sticker.i have basically the same car. do you know which battery/DU/etc we fall into on the table that is posted here?
Last edited:

Thanks for that, that was really helpful. So uncorked the avg 0-60 time is almost 4 seconds? wow. any idea why Tesla is publishing 4.2 and not 4.0? I thought manufacturers would be overly aggressive in their claims, not conservative.All drive units before June 2017 are old(er) and battery is almost certainly BTX5. I only know one BTX7 owner. All the BTX8 owners are outside the US. You can check your option codes or battery sticker.
Also, what's the significance of the one foot roll out? Why not measure from standstill?
Chasedrgc1223
Nearly Insane
Yeah, don't all the 100s have the same battery part number, even the performance ones, even if the Ps have a different battery option code?I'm a BTX 6 owner.
Isn't it 1086755-00?
Last edited:
cyphear
Member
Excellent work on this. I'm really surprised to see how much more power the 100D's are making, and may switch my order based on this thread. Those are nearing P85D power output!
Why are the power curves so delayed? For example, at 1mph, the cars show it's just at minimal power, like 40kwh. My guess is that it's a trailing average. It seems like the peak power output numbers would be the ones to trust. Is that correct?
Why are the power curves so delayed? For example, at 1mph, the cars show it's just at minimal power, like 40kwh. My guess is that it's a trailing average. It seems like the peak power output numbers would be the ones to trust. Is that correct?
SucreTease
Teslarian
@Krash, I need to challenge what you are calling "power acceleration" in your charts, to which you attach units of kW/s^2. Where did you come up with such this concept? I can understand how one might be interested in the rate at which power increases, whose rate of increase would be measured in kW/s, and would be equal to the slope of the kW vs. time graph (which is a mostly a flat rate of increase in the plots I have seen). However, I cannot image that the acceleration of power is a meaningful or measured quantity (and would be zero if the kW/s rate value is mostly constant.
Kilmore_sweden
Member
Looking at the runlogs I see that the time starts at "negative" (-0.25 sek) for example.
Why is that? And why isn't that added to the total 0-60-time?
Why is that? And why isn't that added to the total 0-60-time?
Chasedrgc1223
Nearly Insane
I believe this is because of the .25s delay in the API being factored in, but Krash will have to elaborate.Looking at the runlogs I see that the time starts at "negative" (-0.25 sek) for example.
Why is that? And why isn't that added to the total 0-60-time?
Why are the power curves so delayed? For example, at 1mph, the cars show it's just at minimal power, like 40kwh. My guess is that it's a trailing average. It seems like the peak power output numbers would be the ones to trust. Is that correct?
There is some trailing average effect but look at the CAN data for Bill D and MikeBur which is more than a magnitude more frequent. The car doesn't reach full power when you press the accelerator. The traction control never comes on to limit the tire spin which should happen on every car. Something else is limiting power, both to differentiate the cars as well as to protect on the massive forces generated on the parts during initial acceleration.
I believe there are four primary drivers of performance and differentiation in the cars: Torque limiting, Power limiting, Current limiting and RPM limiting. In that order. Secondary factors are tire grip, thermal constraints of the individual parts and the electrical wiring. The shape of the power output over time supports this theory.
First, the initial rate of change of power (power acceleration) in constant. It is likely that the car is either set that way in the throttle mapping or that there is another setting (like torque) that results in a linear rate of change or power. This is true until the max power setting is reached.
Second, the max power is reached and the power is relatively constant through the 0-60 time on the slower cars.
Third, the power starts to drop as current (ampere) limits are reached. On some of the faster cars it starts to dip at the end on the 60 mph runs but certainly within the quarter mile you can see that the car power has an inverted, downward sloping curve. I believe that this is due to the exponential amounts of current required to offset the drag of the vehicle through the air at higher velocities, and consequently the remaining current available not being enough to reach max power.
Finally you hit the rpm limits of the motor and the top speed allowed.
SucreTease I welcome your peer review. Rate of change of power IS zero once the power limits are reached. My point in measuring it is that the initial rate of change of power is such an obvious performance differentiator between sport (corked), insane (uncorked) and ludicrous cars at approximately 75, 150 and 300 kWs2. It is the most noticed difference in the cars by the drivers, much more so than max power and the current limits, which are the other settings changed in uncorking. (rate of change of power, max power and max current being the major performance differences between Tesla cars disregarding max battery and launch mode).@Krash, I need to challenge what you are calling "power acceleration" in your charts, to which you attach units of kW/s^2. Where did you come up with such this concept? I can understand how one might be interested in the rate at which power increases, whose rate of increase would be measured in kW/s, and would be equal to the slope of the kW vs. time graph (which is a mostly a flat rate of increase in the plots I have seen). However, I cannot image that the acceleration of power is a meaningful or measured quantity (and would be zero if the kW/s rate value is mostly constant.
Again, I think the linear rate of change of power is determined by a fixed torque setting, which everyone would love to know. Linear rate of change of power is certainly coincidental with a constant torque as observed in Bill D and MikeBur CAN collected data. You will notice that we started posting our torque estimates based on the rate of change of power. Unfortunately there is no physics behind the torque estimates. We are merely fitting the observed data to the Tesla reported data and adjusting as we get more data or a real physics model.
The timed metrics include a rollout. You'll see in the summary footnote that you should add in a quarter second if you don't want a rollout. But actually to be accurate you need to look at whether the end of the run was at 60 vs 63 and adjust the end time accordingly, as well as adjust the start time to interpolate when the accelerator was hit.Looking at the runlogs I see that the time starts at "negative" (-0.25 sek) for example.
Why is that? And why isn't that added to the total 0-60-time?
The main reason for the rollout is that for MANY of the forum supplied cars' runlogs the cars have rolling starts. I needed a time to set at zero. Using the rollout model of saying that the first >1ft distance measured is the zero time makes the API data pretty consistent and is close to the spirit of the magazine rollout model.
You will see even longer negative number leads on the cars that have launch mode since the car is actually loading power on the brakes in advance of the release of the vehicle.
The fact is I am not interested in the 0-60 times or quarter mile times. We have some track verified times and I haven't included them, although on reflection it would be interesting to estimate them from this data. I do think the components that determine those times are interesting because they are all components that Tesla and owners can improve independently over time and because the components have their own practical implications and constraints.
Last edited:
SucreTease
Teslarian
In your response, you make reference to rate of change of power (the first time derivative of power), which is quite different from "power acceleration" (which is the second derivative of power-- the rate of change of the rate of change). Power is measured in kW. The time rate of change of power is measured in kW/s. I agree with all of what you said (except for mistakenly citing "300 kWs2" as a unit of measurement for "initial rate of change of power"). What I am questioning is your table containing values for "power acceleration", measured in units of kW/s^2. Perhaps you have been mislabeling "power velocity" (the time rate of change of velocity, kW/s) as "power acceleration" (kW/s^2)?SucreTease I welcome your peer review. Rate of change of power IS zero once the power limits are reached. My point in measuring it is that the initial rate of change of power is such an obvious performance differentiator between sport (corked), insane (uncorked) and ludicrous cars at approximately 75, 150 and 300 kWs2. It is the most noticed difference in the cars by the drivers, much more so than max power and the current limits, which are the other settings changed in uncorking. (rate of change of power, max power and max current being the major performance differences between Tesla cars disregarding max battery and launch mode).
Again, I think the linear rate of change of power is determined by a fixed torque setting, which everyone would love to know. Linear rate of change of power is certainly coincidental with a constant torque as observed in Bill D and MikeBur CAN collected data. You will notice that we started posting our torque estimates based on the rate of change of power. Unfortunately there is no physics behind the torque estimates. We are merely fitting the observed data to the Tesla reported data and adjusting as we get more data or a real physics model.
cyphear
Member
I have indeed frequently and maybe inconsistently been using the wrong terms. Nice catch and thank you for the correction. I will fix this in the summary at next update.In your response, you make reference to rate of change of power (the first time derivative of power), which is quite different from "power acceleration" (which is the second derivative of power-- the rate of change of the rate of change). Power is measured in kW. The time rate of change of power is measured in kW/s. I agree with all of what you said (except for mistakenly citing "300 kWs2" as a unit of measurement for "initial rate of change of power"). What I am questioning is your table containing values for "power acceleration", measured in units of kW/s^2. Perhaps you have been mislabeling "power velocity" (the time rate of change of velocity, kW/s) as "power acceleration" (kW/s^2)?
So speaking of power over time specifically, a corked entry level S has an initial stage where change of power is 75kW per second and because that change of power (per second, first derivative or power velocity) is constant across the initial period the rate of change (per second per second, second derivative or power acceleration) is indeed zero. As for the second stage where the power is constant and the change between time periods (first derivative) is zero, the rate of change from zero to zero is of course zero as well. Is this correct?
If so, help me understand how to describe the third period where the power decreases at a decreasing rate (only clearly seen on the quarter mile runs). The first derivative is a negative number that approaches zero over time? And the second derivative is a positive number that approaches zero over time?
For any mathematicians or physicists following along please introduce yourselves here or in private conversation. I am unable to convert some formulas to derivative formulas that would be really useful for our efforts in estimating the first stage limits (probably torque) and third stage current limits from observed data.
Last edited:
No preference between apps. Both have altitude, which will be helpful on the quarter mile analysis. Neither have temperature, which would be useful for that and for 60-0 stopping analysis. I am sure the car is reporting the GPS data.@Krash Do you have any preference on log output between Dashboard for Tesla (Android) and PowerTools for Tesla (iOS)? It looks like powertools is more performance focused.
Hopefully they both pull data from the car's GPS, not the phone's GPS? I bet the car's GPS is much more accurate.
SucreTease
Teslarian
For any mathematicians or physicists following along please introduce yourselves here or in private conversation.
Fortunately, I am a physicist.
So speaking of power over time specifically, a corked entry level S has an initial stage where change of power is 75kW per second and because that change of power (per second, first derivative or power velocity) is constant across the initial period the rate of change (per second per second, second derivative or power acceleration) is indeed zero. As for the second stage where the power is constant and the change between time periods (first derivative) is zero, the rate of change from zero to zero is of course zero as well. Is this correct?
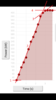
I generally agree with you here. Let's speak about specifically about this post (Upgraded performance Metrics Summary) from @Chasedrgc1223, which is useful because it contains a visualization of the data that would help us in discussions. I would break up this plot into four regions, rather than the three you mentioned.
The first region, not discernible in this diagram because it is too coarsely sampled, begins at time zero, before which it remained at a zero rate of change. At time zero there is a positive acceleration of power from a zero rate of change to a new constant, positive, increasing rate of change of power. This acceleration of power, whose number would be interesting to know for the different power trains, would be experienced by the passenger as the suddenness with which the acceleration jolts the passenger into his/her new state of linear acceleration. That jolt is much harder in the P100D than it is in even the new 100D.
The second region, which occupies the majority of this plot, is during the approximately constant slope upwards (of about 150 kW/s) until approximately 2.5 s, during which the acceleration of power is effectively zero.
The third region, lasting from about 2.5 s until 3.1 s, there is a deceleration of power from the constant rate of increase of about 150 kW/s down to zero, meaning that the power acceleration is about (0 kW/s - 150 kW/s) / 0.6 s = -250 kW/s^2 (a deceleration, really).
The fourth region, beginning at about 3.1 s, we have reached the maximum power output of about 420 kW, the rate of change is zero (i.e. it remains constant), and there acceleration of power is zero. The car will continue its softer linear acceleration until drag (i.e. wind resistance), which increases by the square of the speed, equals the maximum power (approximately; there are other, lesser sources of friction in the drive trains and tires). The car (at this maximum power) no longer can overcome wind resistance.
If so, help me understand how to describe the third period where the power decreases at a decreasing rate (only clearly seen on the quarter mile runs). The first derivative is a negative number that approaches zero over time? And the second derivative is a positive number that approaches zero over time?
Do you have a plot handy that we can use to discuss this?
I am unable to convert some formulas to derivative formulas that would be really useful for our efforts in estimating the first stage limits (probably torque) and third stage current limits from observed data.
If you want, we can discuss it here or over PM. I think the discussion might be interesting for others, though. I have tried briefly, after my previous response to you to convert torque values I found on the Model S page on Wikipedia into accelerations, but my numbers didn't work out. I don't know what I was doing wrong. I've never applied my physics to understanding automotive specs and performance before, so there might be something I was overlooking.
Yes, please do it publicly. Especially with this audience!
For the layman, derivatives are basically the slope of a specific point on a curve (i.e. rise over rate). Attached is an image with 4 lines drawn showing the 4 areas @SucreTease describes above.
Unlike SucreTease, I'm not a physicist, but I have played one on TV, so please correct me if I made a mistake. Thanks!.
Attachments
Last edited:
Yeah, we can do it publically but I'll start a new thread. I can edit the first page of any thread I start which I think makes it easier to keep a summary or index on that first page of what is going on in the thread and in related threads. SucreTease do you want to let me know what you recommend for a title? "Tesla Physics" perhaps? Or something more creative?
@Krash I have a single run log of 0 to 60 with my S 100D. P1 config with DU00 update .42. Do you want that still? I was disappointed it was only 4.250. Couldn't get a full 1/4 for ya either from car limited to 85. I'll see if next week I can do a 90% charge and a pull now that I don't have the speed limiter any more.
Chasedrgc1223
Nearly Insane
What was your maximum kW output if you have that?@Krash I have a single run log of 0 to 60 with my S 100D. P1 config with DU00 update .42. Do you want that still? I was disappointed it was only 4.250. Couldn't get a full 1/4 for ya either from car limited to 85. I'll see if next week I can do a 90% charge and a pull now that I don't have the speed limiter any more.
Similar threads
- Replies
- 13
- Views
- 7K
- Replies
- 6
- Views
- 3K
- Replies
- 0
- Views
- 4K
- Replies
- 16K
- Views
- 1M
- Replies
- 431
- Views
- 75K